Schools
Arizona State University: Student Intern At Cox Collaboratory Tests Video Analytics To Improve Bike Parking At ASU
Imagine you're an ASU student, heading off to class. You hop on your bike, knowing there's a bike rack right outside the building. After ...
Stephanie King
August 19, 2021
Find out what's happening in Tempefor free with the latest updates from Patch.
Imagine you’re an ASU student, heading off to class. You hop on your bike, knowing there’s a bike rack right outside the building. After furiously peddling your way there, you come to find that the rack is full.
Enter panic mode. Now you’re likely hot (it is Arizona, after all), on the verge of running late for class and left wondering where the next nearest rack is, dreading it will also be full.
![]()
Download Full Image
Find out what's happening in Tempefor free with the latest updates from Patch.
After understanding these pain points from the ASU Parking and Transit Services team, the Cox Connected Environments Collaboratory set out to explore smart solutions to improve bike parking on campus.
Arizona State University's Tempe campus currently has more than 12,000 bicycle racks, none of which have any means to track utilization. The Cox Collaboratory team previously evaluated different sensor options for bike racks but found that installation, maintenance and ability to scale were all limiting factors. Their focus then turned to using video to overcome those limitations.
Rachel Hayden, a senior studying engineering mechanical systems at ASU and the collaboratory’s product and technology solutions analyst intern, spent time during her internship this summer creating a video analytics model using machine learning to be able to view and recognize bikes.
 To detect bikes for this project, Hayden used Edge Impulse, a leading development platform that uses machine learning to build analytical models. Here are some of the steps she took to create her model:
Step 1: Hayden had to choose between image classification and object detection. She selected object detection because “we’re looking more at detecting how many bikes there are rather than trying to distinctly tell the difference between a bike and some other object,” she said.
Step 2: Next, Hayden collected about 150 images of bicycles from search engines and uploaded them to Edge Impulse so the model knew what to analyze. “I collected images of singular bikes and multiple bikes that were grouped together,” Hayden said. “Along with a wide variety of backgrounds and different perspectives, looking at bikes from the front side, the back … and then getting different environments.”
Step 3. With each picture that Hayden uploaded, she used a labeling system to identify the bikes in each picture to better teach the model how to identify them. “I uploaded some pictures of scooters and some cars and just put no labels at all because it was just as important to be able to teach the model what was not a bicycle,” Hayden said.
Step 4. From there, Hayden was able to train the model using object detection from data that she had uploaded. With a final precision score of 60%, Hayden was ready to test.
Step 5. When the model was tested on data it had never seen before to see how well it would detect or count bikes in “real life,” the model received an accuracy score of 90.7%. To perform live classification, Edge Impulse allowed for use of a mobile phone for remote connection, which enabled Hayden to collect real-world images and test this new model around the ASU Tempe campus.
With such a high accuracy score, Hayden feels that the model’s success could potentially lead to monitoring overall utilization of racks by accurately counting how many bikes are currently there, optimizing rack placement around campus based on utilization data over time and offer more efficient bike parking by providing students insights into where spots are available.
“We’re proud of the incredible work that Rachel put into this project and her leadership in seeing it through from beginning to end,” said Brian Nickell, product and integration lead for smart communities at Cox2M. “We look forward to seeing how we can use this data and modeling to create a smarter and more efficient environment for ASU students, faculty and staff.”
The project offered win-win objectives for both ASU and the Cox Collaboratory, with some positives including:
For ASU:
For Cox Collaboratory:
Learn more about other cutting-edge projects that Cox Collaboratory interns have done in the past.
Over the last two decades, scientists have found ice in many locations on Mars. Most Martian ice has been observed from orbital satellites like NASA’s Mars Reconnaissance Orbiter. But determining the grain size and dust content of the ice from that far above the surface is challenging. And those aspects of the ice are crucial in helping scientists determine how old the ice is and how it was deposited.
So planetary scientists Aditya Khuller and Philip Christensen of Arizona State University, with Stephen Warren, an Earth ice and snow expert from the University of Washington, developed a new approach to determine how dusty Mars ice really is.
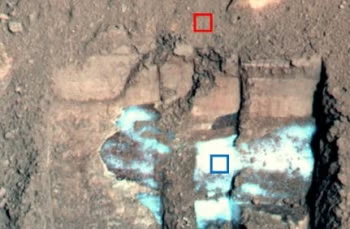
Dusty snow dug up by NASA’s Phoenix Mars Lander, a few centimeters below the surface. The blue box represents ice and the red box represents soil. Credit: NASA/JPL-Caltech/University of Arizona/Texas A&M University.
Download Full Image
By combining data from NASA’s Phoenix Mars Lander and Mars Reconnaissance Orbiter with computer simulations used to predict snow and glacier ice brightness on Earth, they were able to successfully match the brightness of Martian ice and determine its dust content. Their results have been recently published in AGU’s Journal of Geophysical Research: Planets.
Mars is a dusty planet, so much of its ice is also dusty and much darker than fresh snow we might see on Earth. The dustier the ice is, the darker and thus warmer the ice gets, which can affect both its stability and evolution through time. Under certain conditions, this might also mean that the ice could melt on Mars.
“There is a chance that this dusty and dark ice might melt a few centimeters down,” Khuller said. “And any subsurface liquid water produced from melting will be protected from evaporating in Mars’ wispy atmosphere by the overlying blanket of ice.”
Illustration of how small amounts of Martian dust can lower the brightness and change the color of Martian snow. The colored lines in the chart (blue, red, yellow and violet) correspond to how small amounts of dust reduce the brightness of pure snow (represented by a black line) toward the brightness of pure Martian dust (represented by a gray line). The simulated "color" of each type of snow/dust is shown in the black boxes. Notice how the color of snow with 0.1% dust appears very similar to the color of pure dust, as is also seen on the Curiosity rover after a dust storm (Right) Credit: NASA/JPL-Caltech/MSSS.
Based on their simulations, they predict that the ice dug up by the Phoenix Mars Lander formed by dusty snowfall, sometime over the last million years, similar to other ice deposits found previously across the mid-latitudes of Mars.
“It is widely believed that Mars has experienced multiple ice ages throughout its history, and it looks like the ice being exposed throughout the mid-latitudes of Mars is a remnant of this ancient dusty snowfall,” Khuller said.
Ice dug up by NASA’s Phoenix Mars Lander, a few centimeters below the surface. The red and blue boxes indicate locations of brightness measurements shown on the right. Blue represents ice and red represents soil. Credit: NASA/JPL-Caltech/University of Arizona/Texas A&M University. Ice and soil measurements from Blaney et al. (2009).
For next steps, the team hopes to further analyze ice exposures on Mars, assess if the ice could actually melt, and learn more about Mars’ climate history.
“We are working on developing improved computer simulations of Martian ice to study how it evolves over time, and whether it might melt to form liquid water,” Khuller said. “The results from this study will be integral to our work because knowing how dark the ice is directly influences how warm it gets.”
As snow grains grow and coarsen, the amount of air between the grains reduces and the ice appears darker. This reduces the number of light reflections within the ice and increases the probability that the light gets absorbed by the ice. As the grains get larger, the brightness reduces, and older snow, firn and glacier ice appear darker than fresh, clean snow. The figure on the right illustrates how the air within snow gradually reduces to form firn, and eventually glacier ice. Credit: Mattavelli (2016).
This press release was produced by Arizona State University. The views expressed here are the author’s own.