Politics & Government
Belmont Considering Stop Sign Policy
The policy would determine whether a stop sign is warranted at various Belmont intersections.

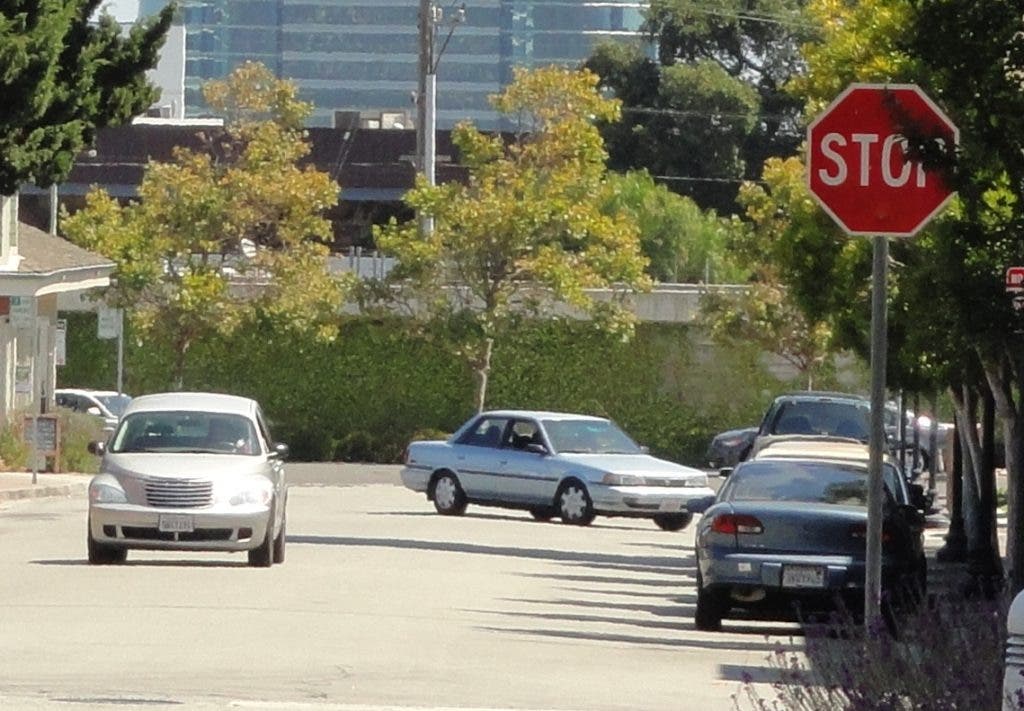
It could soon be much easier to determine whether an intersection in Belmont needs a stop sign.
Belmont currently has criteria for implementing multi-way stop signs, but adding stop signs at all other types of intersections in the city is determined on a case-by-case basis.
The Stop Sign Warrant Policy, developed by traffic engineering firm DKS Consultants, includes guidelines for establishing single, dual and T-intersection stop sign placement, as well as revises the existing multi-way installation policy.
Find out what's happening in Belmontfor free with the latest updates from Patch.
When creating the policy, DKS Consultants looked into stop sign policies implemented by other cities, including San Mateo, Palo Alto, Danville and Dixon.
Of those cities, only Dixon has established requirements for adding a stop sign to a T-intersection -- the other cities operate on a case-by-case basis for those types of intersections, according to the policy. Belmont's proposed policy does include qualifications for a stop sign at a T-intersection.
Find out what's happening in Belmontfor free with the latest updates from Patch.
The City Council on Tuesday night opted to postpone adopting the policy, and instead called for a presentation at an upcoming meeting in order to further understand the policy.
-------------------------------------------------------------------------------
BELMONT'S PROPOSED STOP SIGN WARRANT POLICY
The following outlines the proposed criteria for the installation of all-way stop signs, 3 stop signs at T-intersections, 2-way stop signs on minor streets, and single-stop locations. Updates to the existing all-way stop sign policy are indicated in bold. Stop sign installations may be considered if ANY of the following conditions exist:
1. Traffic and Pedestrian Volumes
a. The minimum hourly average (for any eight hours) vehicular volume entering the intersection from all approaches on an average day and the vehicular volume entering the intersection from the minor street or streets for the same eight hours must meet the following criterion:
Minimum Hourly Average (vehicles per hour) Vehicular Volume from Minor Street(s)* All-Way Stop Signs 300 1/3 3-Way Stop Signs on T-Intersections 225 1/4 2-Way Stop Signs on Minor Streets 300 1/5 Single-Stop Signs on Minor Streets 225 1/4
*Fraction of total volume per hour minimum.
b. The minimum hourly average (for any eight hours) vehicular volume entering the intersection on the major approach and the pedestrian volume per hour crossing during the same eight hours must meet the following criterion.
Minimum Hourly Average (vehicles per hour) Pedestrian Volume (pedestrians per hour) All-Way Stop Signs 150 75 crossing the major approach 3-Way Stop Signs on T-Intersections 60 30 crossing the major approach 2-Way Stop Signs on Minor Streets 40 30 crossing the major approach Single-Stop Signs
100 30 crossing the major approach
2. Accident History
Three or more types susceptible to correction by stop signs within a 12-month period, with satisfactory observance and enforcement of less restrictive control.
3. Sight Distances
The straight line sight distance (the length of roadway in a straight line that is visible to the driver) of one or more approaches of the major street for vehicles or pedestrians crossing the intersection is less than 150 feet, or if the stopping sight distance (the distance traveled when a vehicle driver is required to stop) for roadways with approach grades of +/- 3% for vehicles on one or more approaches of the major street does not meet the 2004 edition of the American Association of State Highway and Transportation Officials’ (AASHTO) A Policy on Geometric Design and Highways and Streets.
Speed (mph) 15 20 25 30 35 40 45 Stopping Distance (ft) 80 115 155 200 250 305 360For approach grades steeper than +/- 3%, the following table provides adjustment factors with respect to the appropriate approach grade.
Approach Grade (%) 15 mph 20 mph 25 mph 30 mph 35 mph 40 mph 45 mph -6 1.1 1.1 1.1 1.1 1.1 1.1 1.1 -5 1.0 1.0 1.1 1.1 1.1 1.1 1.1 -4 1.0 1.0 1.0 1.1 1.1 1.1 1.1 -3 to +3 1.0 1.0 1.0 1.0 1.0 1.0 1.0 +4 1.0 1.0 1.0 1.0 1.0 0.9 0.9 +5 1.0 1.0 1.0 1.0 0.9 0.9 0.9 +6 1.0 1.0 0.9 0.9 0.9 0.9 0.94. High–Pedestrian Generators
High concentrations of pedestrian traffic in areas such as in the vicinity of schools, playgrounds, and shopping centers.
5. Visible Signs of Traffic Issues
Skid marks, fixed object collisions, and other potential traffic problems.
6. Traffic Volume Equilibrium
The intersection approach volumes for the major and minor streets near equilibrium as determined by the City of Belmont staff. Typically, intersection equilibrium for an intersection is reached when approach volumes for the minor/major legs reach 45%/55% of the total intersection volume.
Get more local news delivered straight to your inbox. Sign up for free Patch newsletters and alerts.