Seasonal & Holidays
Which Florida Cities Rank Highest For Halloween Fun?
Halloween is the third most popular holiday in America, and people are willing to dig into their pockets to celebrate the spooky season.

TAMPA, FL — There's one big advantage to living in Florida during the Halloween season. You don't have to worry about wearing a winter coat over the Halloween costume you spent months making.
Whether it's balmy or frigid, Halloween is the third most popular holiday in America, and people are willing to dig into their pockets to celebrate the spooky season.
According to the personal finance website, WalletHub, this year the average U.S. household will spend $86.27 on Halloween, from decorations to treats to costumes. Collectively, that’s about $8.8 billion. So, if you’re counting on getting a return on your investment, you’ll want to be in a place with lots of activities.
Find out what's happening in Tampafor free with the latest updates from Patch.
To determine which cities give Halloween lovers the most for their money, WalletHub compared the 100 largest U.S. cities based on 21 key metrics, ranging from costume stores per capita to average price per Halloween party ticket to share of potential trick-or-treat stops.
The result is 2019's Best Places for Halloween.
Find out what's happening in Tampafor free with the latest updates from Patch.
Miami ranked laudable 7 on the list of 100 cities, receiving a score of 35 for trick-or-treater friendliness, 8 for Halloween fun and 33 for Halloween weather.
Tampa Bay didn't fare quite as well.
Tampa received an overall rank of 37 on the list, scoring 57 for trick-or-treater friendliness, 15 for Halloween fun and 33 for Halloween weather.
St. Petersburg received a better score for weather despite the fact that the weather in the two Tampa Bay cities is pretty much the same. (St. Pete scored 23). However, St. Petersburg scored a dismal 82 for trick-or-treater friendliness and a downright insulting 84 for Halloween fun.
Orlando ranked 61 overall. The city, offering an abundance of slick theme park Halloween events, scored 2 for Halloween fun but scored poorly (94) for trick-or-treater friendliness and Halloween weather.
The criteria below shows how WalletHub measured each metric.
Graphic by WalletHub
Trick-or-Treater-Friendliness – Total Points: 60
- Share of Potential Trick-or-Treaters: Double Weight (~14.12 Points)This metric measures the share of the population aged 14 years and younger.
- Share of Potential Trick-or-Treat Stops: Half Weight (~3.53 Points)This metric measures the share of occupied housing units.
- Population Density: Full Weight (~7.06 Points)
- Walk Score: Full Weight (~7.06 Points)Note: “Walk Score” measures walkability and pedestrian friendliness by analyzing population density and road metrics such as block length and intersection density.
- Crime Rate: Double Weight (~14.12 Points)Note: This metric was used as a proxy for neighborhood security.
- Motor Vehicle Crash Related Pedestrian Fatality Rate: Full Weight (~7.06 Points)
- Perception of Safety (Safety walking alone during daylight/night): Full Weight (~7.06 Points)Note: These data are based on perceptions of visitors of Numbeo website in the past 3 years. If the value is 0, it means it is perceived as very low, and if the value is 100, it means it is perceived as very high.
Halloween Fun – Total Points: 30
- Average Price per Halloween Party Ticket: Full Weight (~2.86 Points)Note: Average prices are based on Halloween events listed on Eventbrite.com as of September 23, 2019, where at least two events were available.
- Google Search Index for “Halloween Parties”: Full Weight (~2.86 Points)
- Halloween Costume Stores per Capita*: Full Weight (~2.86 Points)
- Halloween Party Supply Stores per Capita*: Full Weight (~2.86 Points)
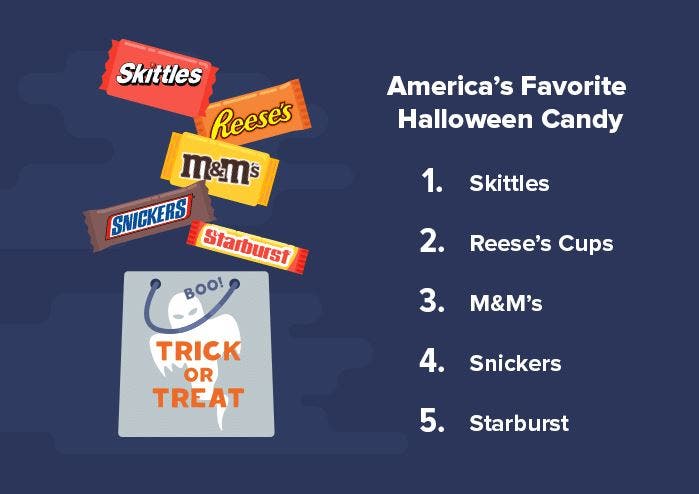
- Candy & Chocolate Stores per Capita*: Full Weight (~2.86 Points)
- Haunted Houses per Capita*: Full Weight (~2.86 Points)
- Farms per Capita*: Half Weight (~1.43 Points)
- Pumpkin Patches per Capita*: Full Weight (~2.86 Points)
- Movie Theaters per Capita*: Half Weight (~1.43 Points)Note: This metric was used as a proxy for horror films timed with Halloween.
- Average Price per Movie Ticket: Half Weight (~1.43 Points)
- Bars & Dance Clubs per Capita*: Full Weight (~2.86 Points)
- Number of Amusement Parks: Full Weight (~2.86 Points)
Halloween Weather – Total Points: 10
- Halloween Temperature vs. Average Temperature: Full Weight (~5.00 Points)Note: This metric measures the difference between the average forecasted temperature for Halloween and the average normal temperature for this time period.
- Forecasted Halloween Precipitation: Full Weight (~5.00 Points)
Get more local news delivered straight to your inbox. Sign up for free Patch newsletters and alerts.