Neighbor News
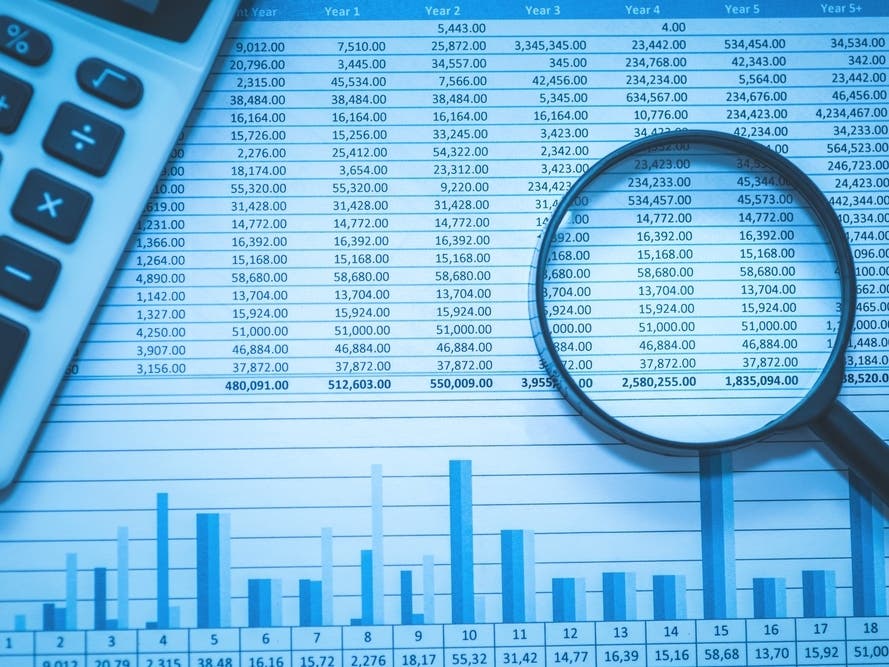
District 102 Financials for Years 2015, 1995, 1975
Bonds, Revenue, Expenses and Pension Payment
The following table illustrates that over the last 40 years District 102 spends more money than income. Not included in the table is the teacher pension payment that your State Income tax pays on behalf of the District. In 2015 that amount was $6,898,188!
According to the State’s testing 39.7% of District 102 students don’t perform at their grade level! * Yet spending goes up faster than your income.
Category 1975 1995 2015
Find out what's happening in La Grangefor free with the latest updates from Patch.
CPI for Urban Workers ** 55.8 150.9 230.8
Bonds outstanding $4,000,000 $13,825,000 $46,564,015
Find out what's happening in La Grangefor free with the latest updates from Patch.
Local Revenue $3,372,376 $12,347,469 $30,141,387
State Revenue $1,308,735 $ 1,552,969 $ 4,056,498
Federal Revenue $ 34,408 $ 207,081 $ 898,642
Total Revenue $4,715,579 $14,107,519 $35,096,527
Instruction Expenses $2,273,970 $ 7,858,915 $30,874,632
Other Expenses $2,185,834 $ 6,075,952 $ 3,082,486
Debt Payment $ 383,604 $ 1,243,762 $ 4,362,675
Total Expenses $4,843,408 $15,178,629 $40,947,994 ***
Spending Excess of Revenue $ 127,829 $ 1,071,110 $ 5,851,467
* Page 4 of 2015 Illinois District Report Card by Illinois State Board of Education
** Table 27. Historical Consumer Price Index for Urban Wage Earners and Clerical Workers.
CPI Detailed Report December 2015, Bureau of Labor Statistics, Washington, DC
*** Does not include site and construction spending of $2,302,918