Health & Fitness
Wilmette 2011 Year End Neighborhood Market Update
Curious to see how single familiy home prices fared in 2011 by elementry school neighborhood, check out this recent post from NewTrierLiving.info.
I find general figures used in determining how various areas are faring based upon median sale price are often misleading as they do not take into consideration location, especially when evaluating larger towns and villages that have a varied housing stock spread across a wide radius.
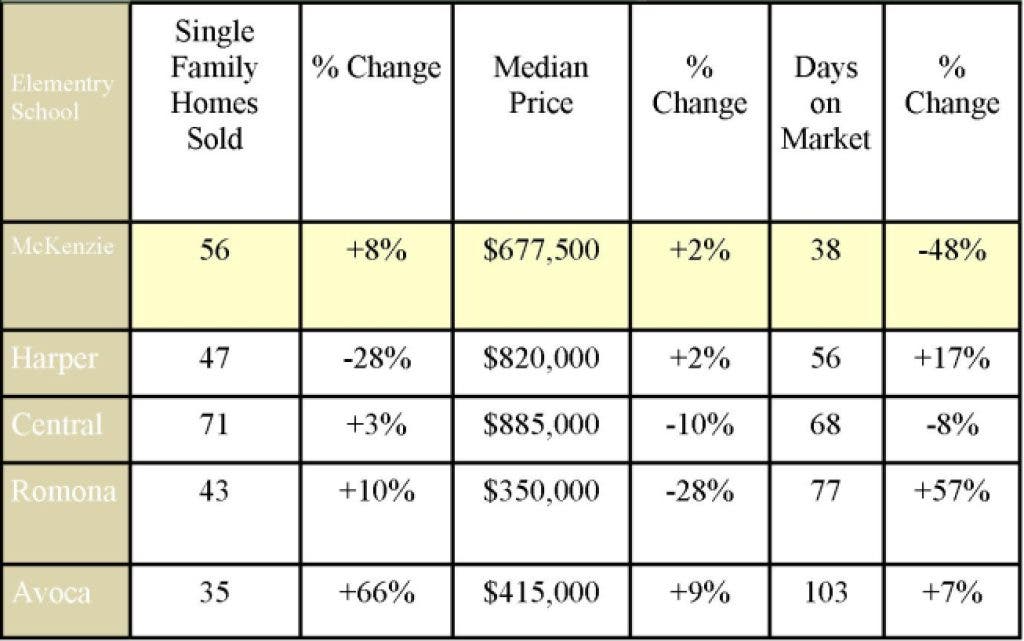
With this in mind, I've put together a neighborhood recap of the year in Wilmette, highlighting single family homes by elementary school and comparing the performance data to 2010 using the following variables: total properties sold, median sales price and days on the market.
Certain neighborhoods have fared better than others when looking at the median sale price. However it's also important to look at days on the market and number of properties sold, as this too will give you a more accurate read of how a particular pocket or area is performing. For example the neighborhood had a strong showing in 2011, with 56 properties selling, up 8 percent from a year ago. The median home sell price sold was up 2 percent and market time was down dramatically to almost 50 percent, a sign that supply is greater than demand! For more detailed information about how your local neighborhood has fared, feel free to contact me.