Community Corner
Maryland Among Worst States For Drivers: Report
According to a WalletHub report, Maryland ranks as one of the three worst states for drivers. Do you agree?

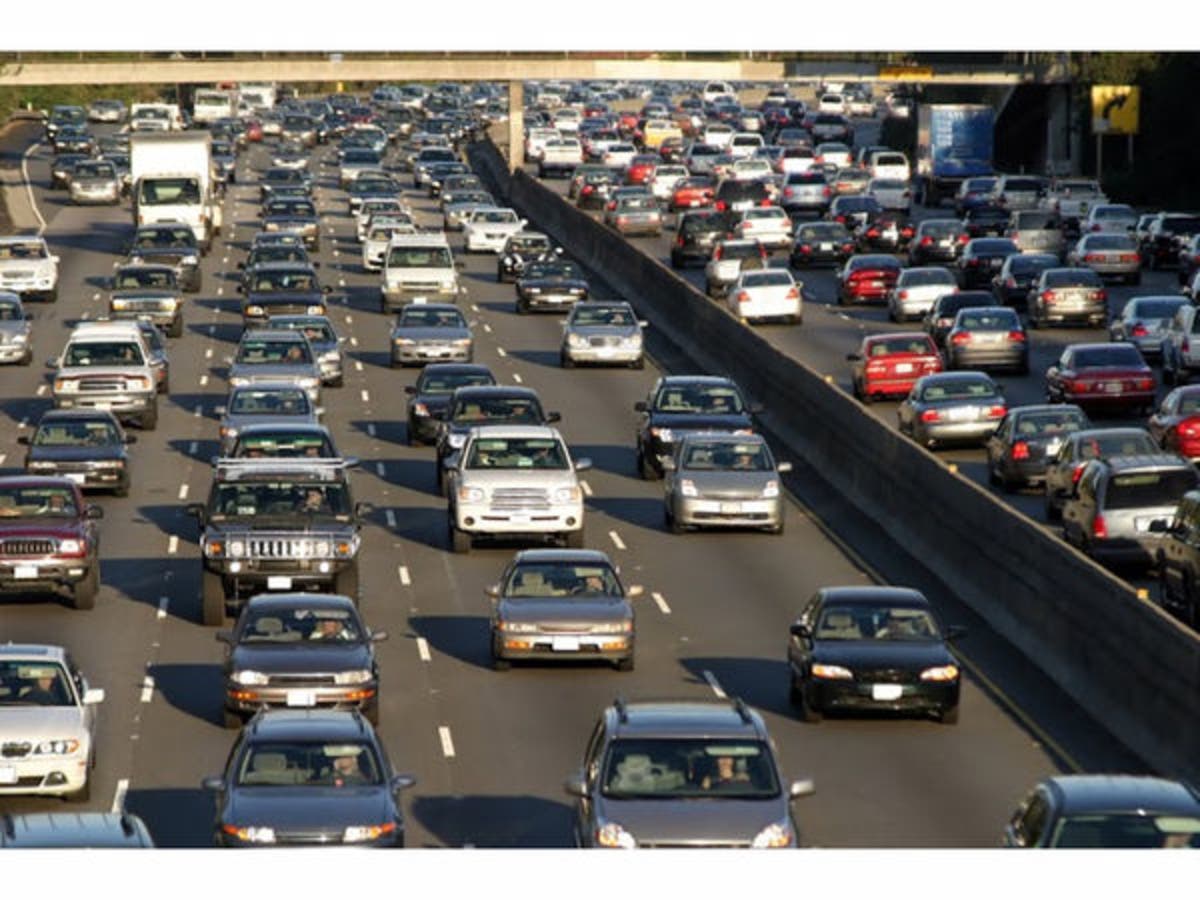
ANNAPOLIS, MD — Every Maryland driver knows the state's interstate highways are clogged since most commuters are trapped on those busy roads every day, since a new ranking of the worst states to drive in likely confirms what you already know. Maryland is one of the worst states in the country to be on the road, according to a new ranking by the personal finance website WalletHub.
Along with the aggravation of sitting in traffic, delays mean money, says the website, costing the average driver $1,400 per year in the United States. Traffic jams aren't the only hazard Marylanders face, there's also dicey road conditions and fluctuating gas prices to vex drivers.
Taking those conditions and other factors into consideration WalletHub ranked the states from best to worst for drivers, with No. 50 being the absolute worst. That honor goes to Hawaii, while the rest of the bottom five is Washington, Maryland, California and Connecticut.
Find out what's happening in Annapolisfor free with the latest updates from Patch.
Maryland also is one of the worst states for the percentage of rush-hour congestion, ranking at No. 41.
A 2016 report by TRIP, a Washington, DC-based national transportation organization, said 75 percent of Maryland's urban Interstate highways are congested during peak hours, the second-highest rate in the nation.
Find out what's happening in Annapolisfor free with the latest updates from Patch.
The states ranked in the top five for drivers are:
1. Texas
2. Kansas
3. Nebraska
4. Iowa
5. North Carolina
See the full WalletHub report here.
WalletHub Methodology
To help drivers identify the states that provide the best commuting conditions, WalletHub compared the 50 states across four key dimensions: 1) Cost of Ownership & Maintenance, 2) Traffic & Infrastructure, 3) Safety and 4) Access to Vehicles & Maintenance.
We evaluated those dimensions using 23 relevant metrics, which are listed below with their corresponding weights. Each metric was graded on a 100-point scale, with a score of 100 representing the best for drivers.
Finally, we determined each state’s weighted average across all metrics to calculate its overall score and used the following scores to rank-order our sample.
For metrics marked with an asterisk (*), the square root of the population was used to calculate the population size in order to avoid overcompensating for minor differences across states.
Image via Shutterstock
Get more local news delivered straight to your inbox. Sign up for free Patch newsletters and alerts.