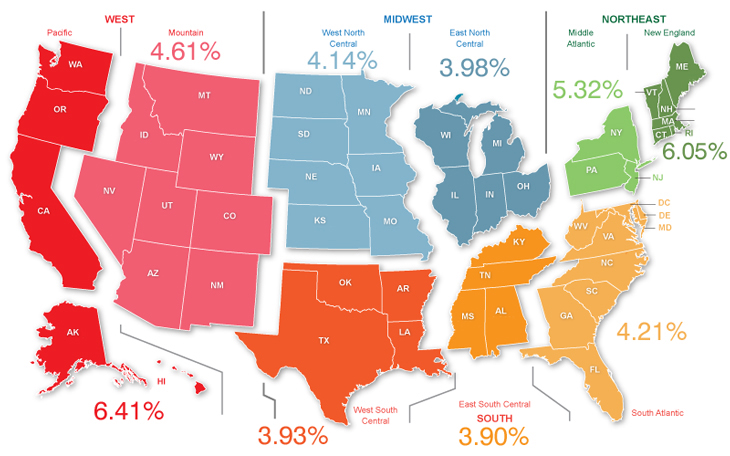
The map and mini charts above are color coordinated by Census Division. The figures evidence the average annual appreciation per national division. The appreciation figures shown are derived from the Federal Housing Finance Administration (FHFA) All Transactions Data. Appreciation will vary from year to year, can decline and for any individual property, can be more or less than the averages illustrated here.