Politics & Government
Data Shows Maryland Communities Becoming More Politically Polarized
Republicans have strongholds where Democrats used to reign and vice versa, according to figures from the Sunlight Foundation.

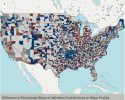
A county-by-county breakdown of federal campaign contributions during the last 20 years shows Maryland following a national trend of communities becoming more politically polarized.
The Sunlight Foundation recently compiled federal campaign finance data trying to determine political influence by county, and developed maps with Azavea Fellow to illustrate that influence.
Although Maryland did not have a jurisdiction in the foundation’s top 10 list of influential counties, the maps did reveal shifts in Maryland’s political alignment during the past 20 years.
Find out what's happening in Upper Marlborofor free with the latest updates from Patch.
For instance, in 1992, Carroll County, now one of the most reliably Republican counties in the state, donated more money to former President Bill Clinton's campaign than to former President George H.W. Bush's. During that same year Prince George’s County residents, who are now overwhelmingly Democrats, only donated $7,345 more to Clinton than Bush.
During the same time period, the amount of money being donated by residents has also increased sharply. The increase is not just in the amount being donated, which can be explained by population increases, but per capita donations have also gone up.
Find out what's happening in Upper Marlborofor free with the latest updates from Patch.
Check out below how the campaign contributions changed in the Maryland counties covered by Patch between 1992 and 2000.
Anne Arundel County
1992
- Total contributions: $750,474
- Per capita: $1.71
- Democratic presidential contributions: $35,150 (53.89 percent)
- Republican presidential contributions: $23,390 (35.86 percent)
2000
- Total Contributions: $2.2 million
- Per capita: $4.50
- Democratic presidential contributions: $161,025 (37.26 percent)
- Republican presidential contributions: $254,315 (58.84 percent)
2012
- Total contributions: $10.5 million
- Per capita: $19.20
- Democratic presidential contributions: $633,883 (44.18 percent)
- Republican presidential contributions: $798,350 (55.64 percent)
Baltimore County
1992
- Total contributions: $1.3 million
- Per capita: $1.87
- Democratic presidential contributions: $89,399 (59.4 percent)
- Republican presidential contributions: 59,900 (39.8 percent)
2000
- Total contributions: $3.3 million
- Per capita: $4.39
- Democratic presidential contributions: $254,984 (42.38 percent)
- Republican presidential contributions: $336,742 (56.1 percent)
2012
- Total contributions: $8.03 million
- Per capita: $9.83
- Democratic presidential contributions: $1.15 million (59.68 percent)
- Republican presidential contributions: $772,503 (40.03 percent)
Carroll County
1992
- Total contributions: $65,472
- Per capita: .50
- Democratic presidential contributions: $2,250 (52.33 percent)
- Republican presidential contributions: $2,050 (47.67 percent)
2000
- Total contributions: $203,924
- Per capita: $1.35
- Democratic presidential contributions: $7,280 (35.43 percent)
- Republican presidential contributions: $13,500 (63.5 percent)
2012
- Total contributions: $371,954
- Per capita: $2.22
- Democratic presidential contributions: $51,063 (37.85 percent)
- Republican presidential contributions: $83,847 (62.15 percent)
Harford County
1992
- Total contributions $84,145
- Per capita: .43
- Democratic presidential contributions: $7,450 (78.31 percent)
- Republican presidential contributions: $1,500 (15.77 percent)
2000
- Total contributions: $228,003
- Per capita: $1.04
- Democratic presidential contributions: $14,325 (33.54 percent)
- Republican presidential contributions: $28,387 (66.46 percent)
2012
- Total contributions: $693,638
- Per capita: $2.79
- Democratic presidential contributions: $81,706 (43.5 percent)
- Republican presidential contributions: $106,140 (56.50 percent)
Howard County
1992
- Total contributions: $343,322
- Per capita: $1.72
- Democratic presidential contributions: $20,850 (46.23 percent)
- Republican presidential contributions: $23,050 (51.11 percent)
2000
- Total contributions: $1.02 million
- Per capita: $4.15
- Democratic presidential contributions: $66,040 (35.35 percent)
- Republican presidential contributions: $115,805 (62 percent)
2012
- Total contributions: $3.6 million
- Per capita: $12.17
- Democratic presidential contributions: $736,232 (64.94 percent)
- Republican presidential contributions: $396,660 (34.99 percent)
Montgomery County
1992
- Total contributions: $7.02 million
- Per capita: $8.97
- Democratic presidential contributions: $549,768 (61.2 percent)
- Republican presidential contributions: $340,155 (37.87 percent)
2000
- Total contributions: $18.9 million
- Per capita: $21.65
- Democratic presidential contributions: $1.49 million (50.72 percent)
- Republican presidential contributions: $1.39 million (47.31 percent)
2012
- Total contributions: $41.1 million
- Per capita: $40.92
- Democratic presidential contributions: $7.2 million (68.53 percent)
- Republican presidential contributions: $3.29 million (31.29 percent)
Prince George’s County
1992
- Total contributions: $849,805
- Per capita: $1.15
- Democratic presidential contributions: $38,725 (54.87 percent)
- Republican presidential contributions: $31,380 (44.46 percent)
2000
- Total contributions: $1.79 million
- Per capita: $2.25
- Democratic presidential contributions: $121,470 (57.08 percent)
- Republican presidential contributions: $87,137 (40.95 percent)
2012
- Total contributions: $3.66 million
- Per capita: $4.15
- Democratic presidential contributions: $1.13 million (87.6 percent)
- Republican presidential contributions: $159,171 (12.32 percent)
Get more local news delivered straight to your inbox. Sign up for free Patch newsletters and alerts.