Schools
District Makes Both Strides and Setbacks in MAP Testing
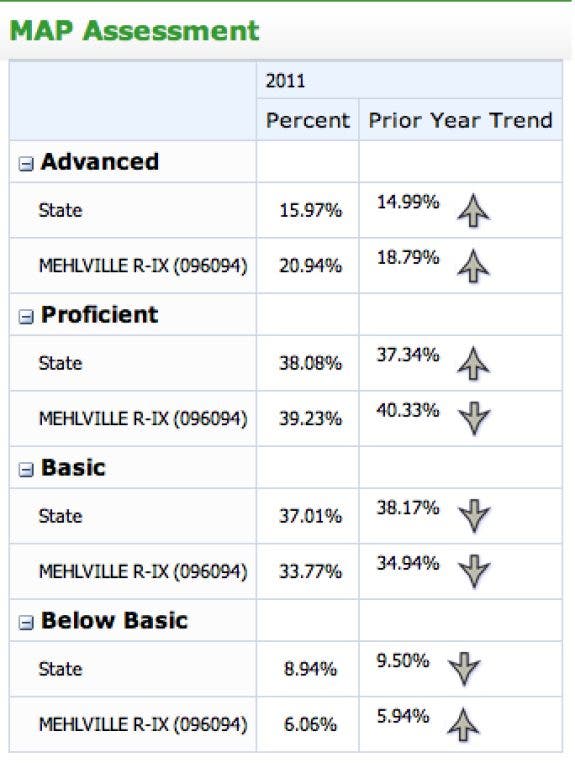
A closer look at the district's MAP testing data.


One school in the Mehlville School District will have to undergo minor changes as a result of the .
As a whole, the district scored above the state average in reading and math, and met the attendance and graduation requirements. Three district schools also made Adequate Yearly Progress— the state’s benchmarks for achievement.
The No Child Left Behind Act plots a system to have every child in every school achieving Proficient or Advanced on state tests by 2014. Each state creates benchmarks in reading (75.5 percent) and math (72.5 percent) each year to measure school and district’s progress. Hitting these benchmarks is making Adequate Yearly Progress (AYP), something only 25 percent of Missouri school districts achieved in the 2010-2011 school year.
Find out what's happening in Mehlville-Oakvillefor free with the latest updates from Patch.
Students are broken up into subgroups based off race and ethnicity (Asian/Pacific Islander, American Indian/Alaskan Native, Black, Hispanic, White and Multi-Racial), according to the Missouri Department of Elementary and Secondary Education (DESE).
There are also subgroups in Limited English Proficiency (LEP), students with Individualized Education Plans, and students who are eligible for free and reduced lunch. One student can be in more than one subgroup. Breaking students into subgroups allows schools and states to analyze strengths and weaknesses based on different variables.
Find out what's happening in Mehlville-Oakvillefor free with the latest updates from Patch.
If one subgroup of one school does not make AYP—with students scoring Proficient or Advanced—the entire district fails to make AYP.
Superintendent Eric Knost said that MAP data was not a perfect look into the district’s academic success.
“A kid could be below Proficient or Advanced, but it could be the best score they’ve ever achieved in their entire life,” Knost said. “Unfortunately, when people start talking about pass/fail, it doesn’t tell the entire story. We’re at the point in the game with No Child Left Behind (NCLB) where the dominoes are going to fall.”
Knost said the administration was still sorting through all of the meanings from the test results, but the district as a whole would not have to make any mandated changes as a result of NCLB.
While the district did not meet AYP in math or reading, it did achieve AYP in graduation and attendance rates.
“I’m happy with what we’re doing with things like our attendance and graduation rates,” Knost said. “Like the alternative programs, we’ve put those things in place to keep those kids in school.”
Individual Schools
Three of the district’s elementary schools (, and ) made AYP in all of their subgroups with a confidence interval that Knost said is how most schools were meeting AYP.
“They’re (DESE) looking at the improvements that have been made and considering trajectory and saying ‘if things continue, you will be making AYP,’” Knost said.
Aside from three schools making AYP, the district saw a 16.8 percent increase in proficient Algebra 1 scores and a 2 percent increase in English 2 scores at the high school level.
Knost attributed the achievements at the high school level, as well as other MAP successes, to an individualized learning plan the district is trying to implement in every classroom.
“We continue to have a specific focus on what teachers are doing for individual kids and a lot of it has to do with tiered interventions,” he said.
Knost explained that these tiers are comprised of three levels. Teachers educate 80 percent of the kids as part of their normal classroom. On the second tier are 15 percent of the kids, who need small group instruction and a little more specific hands-on approach. The third tier is the other 5 percent of kids, who need extra instruction to succeed like after-school tutoring.
“The focus is on individual students, not only MAP testing but through other data sets,” he said. “The goal is to focus on individual students. Each building has a data team. Each grade level has teams. All of them are designed to analyze data and inform instruction in the classroom."
Knost said teachers are using this model for learning in the classroom to make sure every child learns each lesson.
is changing their school improvement plan to a more intense model of this tier system. As a result of the MAP test results, the school is classified as a School Improvement Level 3, which means it must make corrective actions toward improvement.
Knost explained the school had several options, and is going to change to a Professional Learning Community (PLC) school improvement plan, a model already used by other schools in the district, including Oakville High School.
“It’s a lot of teaming and looking at individual kids,” Knost said.
Bierbaum is the district’s largest elementary school and had five subgroups both in math and reading that were required to make AYP. The more diverse the school is, the more groups they have. None of the subgroups met the state’s benchmarks in reading and math.
The school’s changes are a result of its Title 1 status, meaning it receives more federal funding because of the area's low-income families.
Director of Curriculum Connie Hurst-Bayless explained some schools in the district are a Title 1 school based on the Census Poverty Count of both public and non-public schooled kids. Beasley, Forder and Oakville Elementary are also Title 1 schools in the district.
Other schools in the district won’t face sanctions, because it is their first or second year in a row not making AYP and don't receive Title 1 funding, Knost said.
Groups of Students
As a whole, the district saw an improvement in the scores of its students who speak English as a second language (see PDF documents). Especially in math, scores leapt an average of 6 percent or more in students who scored Proficient from 2010 to 2011.
Like most districts in the state, a large disparity still exists between the scores of black and white students (see PDF documents).
In math in grades three to eight, DESE-categorized white students scored from 55.5 percent to 73.8 percent Proficiency while DESE-categorized black students scored 13.6 percent to 50 percent Proficiency.
“Educators have been trying to tackle that for years and years,” Knost said. “What we’ve added is this more individualized approach.”
Knost said that other factors needed to be accounted for, since students can be categorized in more than one subgroup.
“A lot of people want to suggest different things with different minority groups, but if you look at cross-over with free and reduced (lunch), we all know that people that come from a lower socioeconomic status struggle more, because there’s all kinds of variables that play at that,” he said.
that he is exploring the idea of raising the student pass/fail mark from 60 to 70 percent at each grade level.
He said there are two different paradigms of thought with affluent and impoverished families. Affluent families inquire about weighted grades, high GPAs and striving to get into a good college or attain the best ACT scores, he said.
For impoverished families, Knost said thoughts ran more to the minimum requirement needed to graduate.
“We’ve got to realize that paradigm exists,” he said. “If kids consistently want to know the minimum to pass, and they can get to that minimum, we need to start taking a look at pushing that up from the bottom.”
Get more local news delivered straight to your inbox. Sign up for free Patch newsletters and alerts.