Crime & Safety
N.J. Towns With Most Marijuana Busts: Is Your Community Here?
What towns have the highest arrest rates for marijuana possession in New Jersey?


Don't ever expect pot busts to be something that's confined to the cities. In New Jersey, you might just find a lot more of them at the beaches.
The ACLU has released a report called "Unequal & Unfair: NJ's War on Marijuana Users" that shows a disproportionate rate of African-Americans are arrested for pot possession. But the report also breaks down pot busts town by town, showing that some towns have a very high rate of arrests compared to other communities.
The report, for instance, notes that African-Americans were nearly 32 times more likely to be arrested than whites in Point Pleasant Beach, where African-Americans account for 1 percent of the population. Point Pleasant Beach Police Chief Joseph Michigan told The Asbury Park Press that there is not racial bias in police enforcement.
Find out what's happening in Point Pleasantfor free with the latest updates from Patch.
"If you are smoking marijuana in the borough of Point Pleasant Beach regardless of race or gender, you are going to be arrested because it's against the law in New Jersey," he told the publication.
Pot use in general seems to be an issue for a number of Jersey Shore communities, however (see list below). Five of the top six towns on the ACLU's list are from Monmouth, Ocean or Cape May counties.
Find out what's happening in Point Pleasantfor free with the latest updates from Patch.
"New Jersey’s arrest practices for marijuana possession illustrate the failure of marijuana enforcement. They have a devastating impact of aggressive, costly, racially disparate punishment for use of a drug that for adults is less dangerous than alcohol," according to the report.
According to the report, New Jersey is making more arrests for marijuana possession than ever before. In 2013, New Jersey law enforcement made 24,067 marijuana possession arrests, 26 percent more than in 2000, when police made 19,607 arrests. Between 2000 and 2013, New Jersey police made nearly 280,000 total marijuana possession arrests.
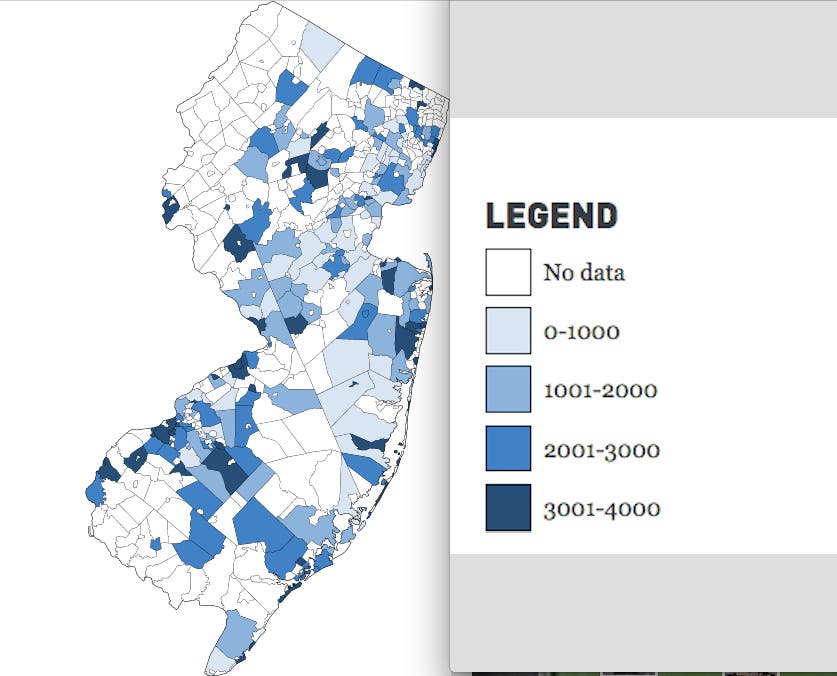
Here are the lists provided by the ACLU from data collected in a survey of police departments.
TOP 50 MUNICIPALITIES WITH HIGHEST PER CAPITA MARIJUANA POSSESSION ARRESTS, 2013 (arrests per 100,000 people):
- SEASIDE PARK 5,028.09
- CHESTER 3,563.64
- SHIP BOTTOM 2,804.57
- BEACH HAVEN 2,757.24
- NORTH WILDWOOD 2,430.44
- NEPTUNE CITY 2,365.56
- ENGLISHTOWN 2,345.95
- MENDHAM TWP 2,287.03
- LAKEHURST 1,624.93
- ROCHELLE PARK TWP 1,504.71
- WILDWOOD 1,434.39
- ASBURY PARK 1,307.02
- POINT PLEASANT BEACH 1,261.00
- HACKENSACK 1,220.01
- SEASIDE HEIGHTS 1,188.80
- MONTVALE 1,098.03
- ROSELLE PARK 1,083.08
- OCEAN TWP 1,023.88
- BORDENTOWN 977.81
- WALL TWP 929.19
- CHESTER TWP 912.36
- GLASSBORO 814.59
- BOONTON TWP 804.58
- HADDON HEIGHTS 791.55
- PINE HILL 790.31
- NEPTUNE TWP 785.71
- BERLIN 779.61
- MAYWOOD 778.56
- SOUTH BOUND BROOK 773.85
- FRANKLIN (Sussex) 765.54
- WATERFORD TWP 722.23
- PENNSVILLE TWP 692.63
- BURLINGTON TWP 661.63
- MOUNT EPHRAIM 653.60
- MOUNT HOLLY TWP 639.31
- MANASQUAN 634.25
- FORT LEE 634.15
- PENNS GROVE 633.57
- CARNEY’S POINT TWP 625.87
- OCEAN CITY 610.54
- STRATFORD 602.18
- PAULSBORO 596.35
- EMERSON 595.17
- HALEDON 579.49
- HIGHTSTOWN 572.62
- EAST HANOVER TWP 562.06
- PITMAN 556.17
- BURLINGTON 555.07
- RED BANK 548.35
- RIVERSIDE TWP 547.69
EACH COUNTY’S TOP 3 MUNICIPALITIES WITH HIGHEST PER CAPITA MARIJUANA POSSESSION ARREST RATE, 2000–2013
Atlantic
- NORTHFIELD 553.23
- EGG HARBOR TWP 387.44
- ATLANTIC CITY 342.96
Bergen
- EDGEWATER 792.97
- MONTVALE 572.12
- FORT LEE 461.76
Burlington
- MOUNT HOLLY TWP 712.49
- BURLINGTON TWP 660.07
- BURLINGTON 552.23
Camden
- MERCHANTVILLE 953.35
- BERLIN TWP 580.39
- WINSLOW TWP 473.62
Cape May
- STONE HARBOR 3,693.45
- WILDWOOD 2,201.52
- NORTH WILDWOOD 1,585.97
Cumberland
- MILLVILLE 393.04
- VINELAND 368.63
- BRIDGETON 283.79
Essex
- NEWARK 340.94
- EAST ORANGE 260.13
- IRVINGTON 254.25
Gloucester
- WESTVILLE 847.07
- PAULSBORO 725.21
- WEST DEPTFORD TWP 575.08
Hudson
- KEARNY 234.54
- BAYONNE 199.60
- UNION CITY 157.39
Hunterdon
- RARITAN TWP 763.07
- READINGTON TWP 299.22
- CLINTON TWP 547.34
Middlesex
- EAST BRUNSWICK TWP 339.40
- PLAINSBORO TWP 247.83
- PERTH AMBOY 212.94
Mercer
- ROBBINSVILLE TWP 515.60
- TRENTON 498.61
- HAMILTON TWP 239.79
Monmouth
- SEA BRIGHT 2,720.15
- ASBURY PARK 1,323.58
- NEPTUNE CITY 972.25
Morris
- HARDING TWP 1,270.10
- MENDHAM TWP 1,057.58
- DENVILLE TWP 454.43
Ocean
- SHIP BOTTOM 3,405.36
- SEASIDE HEIGHTS 2,444.96
- POINT PLEASANT BEACH 1,340.88
Passaic
- LITTLE FALLS TWP 417.42
- RINGWOOD 310.72
- CLIFTON 243.04
Salem
- PENNS GROVE 790.24
- CARNEY’S POINT TWP 480.27
- PENNSVILLE TWP 309.41
Somerset
- BERNARDS TWP 268.31
- HILLSBOROUGH TWP 202.85
- MONTGOMERY TWP 167.42
Sussex
- SPARTA TWP 275.47
- HOPATCONG 240.88
- VERNON TWP 166.01
Union
- ROSELLE PARK 543.42
- CRANFORD TWP 453.35
- PLAINFIELD 282.27
Warren
- POHATCONG TWP 901.88
- PHILLIPSBURG 298.20
Click here to read the whole ACLU report
Patch file photo
Get more local news delivered straight to your inbox. Sign up for free Patch newsletters and alerts.