Community Corner
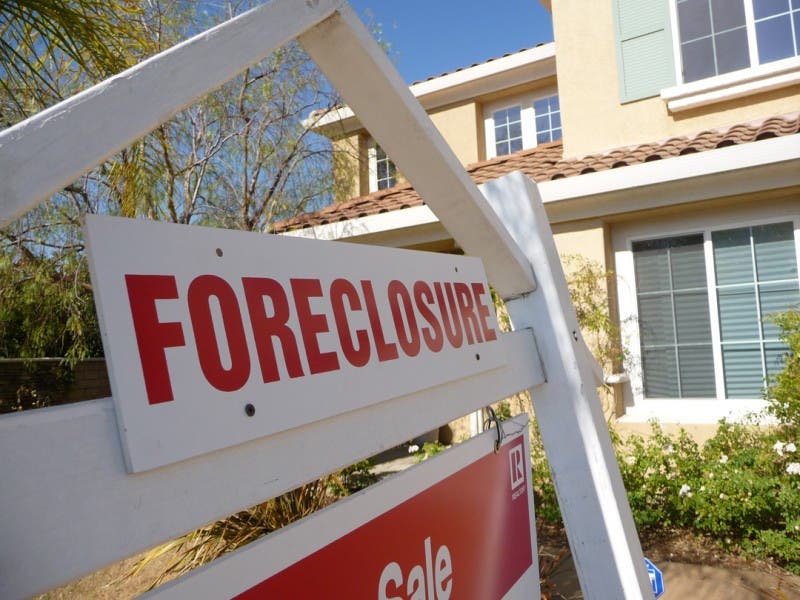
N.J. Towns With Worst Foreclosure Rates - Is Your Town Here?
More than 60 N.J. communities have the among the highest foreclosure rates in the country. Is your town on this list?

By TOM DAVIS and ERIC KIEFER
After conducting its October market report, housing data provider RealtyTrac has some bad news for homeowners across New Jersey.
Homeowners may be struggling with foreclosure again.
Find out what's happening in Westfieldfor free with the latest updates from Patch.
According to RealtyTrac, a company that keeps track of foreclosure rates, 115,134 foreclosure filings were reported across the nation in October, an increase of 6 percent from September.
However, in New Jersey, the increase was more than double the national mark, jumping about 15 percent from last month’s totals. New Jersey’s foreclosure rate of one in every 471 housing units was the second-highest in America for October, RealtyTrac stated.
Find out what's happening in Westfieldfor free with the latest updates from Patch.
More than 60 N.J. towns are among the 500 towns with the highest foreclosure rates in the country, out of more than 10,000 communities (see lists below - communities with no foreclosure filings were not included).
RealtyTrac also rated “metro areas” - areas that have more than 200,000 people - and determined that the “Atlantic City-Hammonton” metro area had the worst foreclosure rate in the country in October. One in every 257 houses was in foreclosure. Trenton was number three.
“The six percent monthly increase in overall foreclosure activity was caused primarily by a 12 percent monthly jump in foreclosure starts, with 48,605 properties starting the foreclosure process for the first time in October,” the company stated in a release. “The October monthly increase was the largest month-over-month increase since August 2011, when there was a 24 percent month-over-month increase.”
Many Jersey Shore communities appeared on the list; Ginny Walker, a spokesperson for RealtyTrac, said that many foreclosures of homes that were damaged in Superstorm Sandy took three years to complete.
Properties repossessed by lenders (REO) in New Jersey were one of the harshest indicators of housing struggles in the state, increasing about 275 percent from a year ago, RealtyTrac stated. In addition, scheduled foreclosure auctions increased 17 percent in New Jersey from October of 2014.
The housing market is tough for renters too, according to a recent study. In July, the National Low Income Housing Coalition stated that a person working at the state minimum wage of $8.38 would need to work 100 hours a week to be able to afford a “modest, 1-bedroom apartment.”
Although up to 34 percent of Garden State residents rent their homes, New Jersey is the 5th most expensive place to do so, the coalition’s study claims.
Below is the list of 100 communities New Jersey communities with the highest foreclosure rates. The number signifies the ratio (example: one out of every 49 houses in Hibernia had a foreclosure filing in October). The list below that is the towns with highest raw totals.
National rankings in parenthesis, if the town fell within the top 200 nationally:
- Hibernia 49 (17th nationally)
- Hancocks Bridge 68 (26th nationally)
- Dorchester 83 (46th nationally)
- Leesburg 99 (62nd nationally)
- Keansburg 100 (63rd nationally)
- Willingboro 105 (68th nationally)
- Dorothy 120 (90th nationally)
- Lawnside 124 (101st nationally)
- Pleasantville 131 (106th nationally)
- Browns Mills 147 (129th nationally)
- Sewaren 148 (132nd nationally)
- Vernon 154 (tied 138th nationally)
- Pennsauken 154 (tied 138th nationally)
- Sicklerville 162 (147th nationally)
- Roselle 163 (150th nationally)
- Mays Landing 176 (177th nationally)
- Egg Harbor Township 176 (tied for 179th nationally)
- Palmyra 178 (tied for 179th nationally)
- Gloucester City 180 (187th nationally)
- Magnolia 182 (195th nationally)
- Clementon 183
- Salem 184
- Forked River (section of Lacey Township) 185
- Absecon 185
- Berlin 185
- Mount Holly 189
- Glendora 193
- Lakehurst 194
- Newtonville 195
- Hillside 198
- Hopatcong 202
- Landing 203
- Burlington 205
- Pemberton 206
- Plainfield 207
- Port Reading 207
- Greenwich 209
- Chatsworth 210
- Landisville 211
- Hewitt 214
- Tuckerton 215
- Newfield 220
- Franklinville 220
- Clayton 221
- Highland Lakes 225
- Merchantville 226
- National Park 227
- Port Elizabeth 231
- Egg Harbor City 233
- New Gretna 246
- Lanoka Harbor (section of Lacey Township) 246
- Swedesboro 251
- Carteret 253
- Williamstown 255
- Beverly 255
- Riverside 257
- Mine Hill 260
- Barrington 266
- Pequannock 267
- Vauxhall 271
- Atco 272
- Vineland 273
- Oaklyn 275
- Linden 276
- Rahway 280
- Northfield 280
- Roosevelt 281
- Waterford Works 282
- Woodbine 283
- Brick 284
- Howell 288
- Clarksburg 288
- Lake Hopatcong 289
- Highlands 295
- Keyport 297
- Manville 298
- Oakhurst 299
- Minotola 300
- Atlantic City 301
- Bound Brook 303
- Bayville 304
- South River 305
- Sussex 306
- Spotswood 306
- Bellmawr 309
- Somerdale 309
- Ledgewood 310
- Pennsville1 310
- Barnegat 315
- Millville 315
- Gibbstown 315
- Cream Ridge 318
- Monroeville 318
- Glen Gardner 320
- Milmay 320
- Westville 321
- Hazlet 321
- Trenton 325
- Mountain Lakes 326
100. Ogdensburg 327
Total numbers:
- Trenton 323 (30th nationally)
- Newark 228 (50th nationally)
- Jersey City 167 (76th nationally)
- Toms River 154 (83rd nationally)
- Plainfield 117 (109th nationally
- Sicklerville 114 (111th nationally)
- Brick 114 (112th nationally)
- Willingboro 109 (120th nationally)
- Clementon 109 (122nd nationally)
- Paterson 109 (123rd nationally)
- Elizabeth 102 (132nd nationally)
- Egg Harbor Township 88 (167th nationally)
- Vineland 84 (184th nationally)
- East Orange 82 (191st nationally)
- Absecon 80 (199th nationally)
- Camden 73
- Atlantic City 70
- Irvington 67
- Mays Landing 63
- Burlington 62
- Linden 60
- Keansburg 59
- Tuckerton 59
- Williamstown 58
- Union 57
- Roselle 55
- Pleasantville 54
- Browns Mills 53
- Clifton 52
- Cherry Hill 51
- Mount Holly 50
- Jackson 50
- Forked River (section of Lacey Township) 47
- Neptune 47
- Millville 46
- Howell 45
- Riverside 44
- Bridgeton 44
- Englishtown 43
- Pennsauken 42
- Bayonne 41
- Merchantville 40
- Rahway 40
- Perth Amboy 40
- Marlton 40
- Mount Laurel 40
- Somerset 40
- Woodbury 39
- Bloomfield 39
- Hillside 38
- North Bergen 38
- Freehold 37
- Wildwood 37
- Union City 37
- Manahawkin 35
- Sewell 35
- Old Bridge 35
- Orange 34
- Long Branch 34
- Carteret 33
- Blackwood (section of Gloucester Township) 33
- Manchester Township 33
- Edison 33
- Barnegat 32
- New Brunswick 32
- Lakewood 32
- Gloucester City 30
- West Orange 30
- Piscataway 30
- Bayville (section of Berkeley Township) 29
- Teaneck 28
- Salem 27
- Swedesboro 27
- Middletown 27
- Newton 27
- Phillipsburg 27
- Belleville 27
- Passaic 27
- Berlin 26
- Hopatcong 26
- Keyport 26
- Sussex 26
- Cape May 26
- Monroe Township 26
- West New York 26
- Hammonton 25
- Vincentown 25
- Hackensack 25
- Voorhees 24
- Hillsborough 24
- East Brunswick 24
- Egg Harbor City 23
- Oaklyn 23
- South Amboy 23
- Englewood 23
- Bordentown 22
- Hightstown 22
- Matawan 22
- North Brunswick 22
100. Asbury Park 22
Get more local news delivered straight to your inbox. Sign up for free Patch newsletters and alerts.