Politics & Government
How NY Counties Voted In Cuomo-Molinaro Race
With one exception, the further north the more conservative the votes were.

Democrat Andrew Cuomo was re-elected to the office of governor for a third term Tuesday. Statewide, according to unofficial results with 15,453 election districts out of 15,529 reporting, Cuomo and his running mate Kathy C. Hochul received 3,352,588 votes — or 57.9 percent of ballots cast.
His Republican challenger — Marc Molinaro and his running mate Julie Killian — received 2,088,381 votes — 36.07 percent of all ballots cast.
Of the other names on the ballot, none received more than 1.65 percent of the votes. That was Howie Hawkins on the Green Party line. Libertarian Larry Sharpe came in at 1.57 percent and Stephanie A. Miner received 0.89 percent.
Find out what's happening in Bedford-Katonahfor free with the latest updates from Patch.
A look at how the Hudson Valley, Long Island and New York City voted found that both Cuomo and Molinaro won their home counties — Westchester and Dutchess, respectively.
Westchester resident and former Rye city councilwoman Julie Killian did not seem to make much of a difference for Molinaro in Westchester however.
Find out what's happening in Bedford-Katonahfor free with the latest updates from Patch.
North of Westchester County, Molinaro got the most votes in Columbia, Dutchess, Orange and Putnam counties. The outlier was Ulster County, which votes for Cuomo.
So how did your county's voters cast their ballots in the gubernatorial race? Check the numbers below.
| Hudson Valley | Cuomo | Molinaro | ||
| No. of votes | % | No. of votes | % | |
| Columbia | 11,109 | 42.44 | 13,339 | 50.96 |
| Dutchess | 47,311 | 44.11 | 56,362 | 52.55 |
| Orange | 53,646 | 44.99 | 58,083 | 48.71 |
| Putnam | 15,257 | 41.1 | 19,838 | 53.44 |
| Rockland | 50,937 | 52.09 | 41,844 | 42.79 |
| Ulster | 37,042 | 50.92 | 31,541 | 43.36 |
| Westchester | 205,817 | 65.55 | 96,057 | 30.59 |
| Long Island | ||||
| Nassau | 263,019 | 55.08 | 193,812 | 40.59 |
| Suffolk | 254,239 | 50.14 | 234,307 | 46.21 |
| New York City | ||||
| Bronx* | 232,899 | 89.56 | 20,638 | 7.94 |
| Kings* | 488,023 | 81.31 | 79,733 | 13.28 |
| New York* | 414.951 | 85.42 | 47,499 | 9.78 |
| Queens* | 366,373 | 77.58 | 85,683 | 18.14 |
| Richmond | 65,316 | 48.96 | 64,143 | 48.08 |
*Number of election districts reporting for Bronx, 980/999; for Kings, 1842/1843; for New York, 1274/1298; Queens, 1426/1434. All other counties had all election districts reporting, according to the state Board of Elections.
This map shows how Democratic New York Gov. Andrew Cuomo won majorities in New York City, Long Island and most upstate cities while Republican Marc Molinaro won in the rest of upstate. (Enterprise graphic — Steve Bradley) https://t.co/kMFe96hpc2 pic.twitter.com/Tj3sfdMEvE
— Adk Daily Enterprise (@AdkEnterprise) November 7, 2018
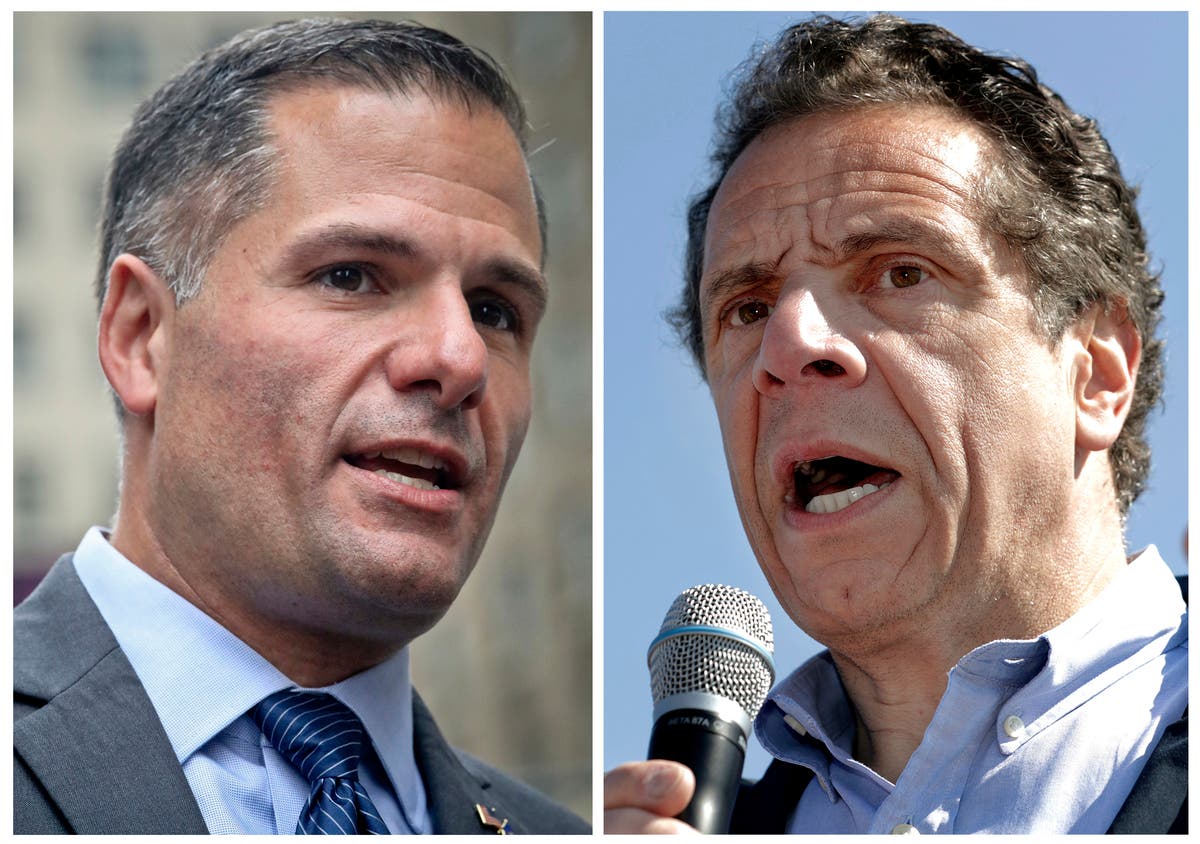
Photo caption: From left, Marc Molinaro and Andrew Cuomo. Photo credits: AP Photos/Bebeto Matthews, left, and Julio Cortez, Files.
Get more local news delivered straight to your inbox. Sign up for free Patch newsletters and alerts.