Health & Fitness
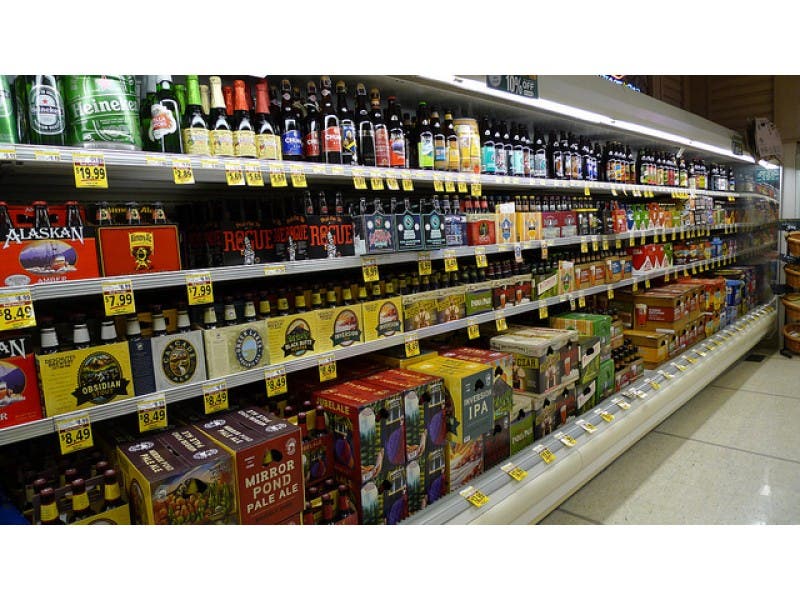
New York Residents Drink the 15th Most Alcohol in Nation: Report
The report examined drinking patterns in the summer months for all 50 states, and even highlights which days people drink the most.

Written by BRIAN MCCREADY (Patch Staff)
A new study shows that New York residents really like to drink alcoholic beverages during the summer months of June, July and August — especially during the Fourth of July holiday.
New York residents drink the 15th most in the country during the summer months, according to the BacTrack Consumption Report. New York is technically tied for 15th with Wisconsin with an average Blood Alcohol Content of 0.070.
Find out what's happening in White Plainsfor free with the latest updates from Patch.
The top 5 states that consume the most amount of alcohol in the summer months are West Virginia, 0.103 (BAC), Nevada, 0.096 (BAC), Pennsylvania, 0.089 (BAC), and then Connecticut, 0.088 (BAC).
Other states ahead of New York include: New Hampshire, South Carolina, Ohio, Indiana, Montana, Vermont, Arkansas, South Dakota, and New Jersey.
Find out what's happening in White Plainsfor free with the latest updates from Patch.
The states with the lowest BAC are Kentucky, Delaware and Washington, D.C, according to the report.
BacTrack says it examined Blood Alcohol Content levels during the summer months of June, July, and August 2014 which included 71,000 unique tests collected from anonymous users.
Some of the report’s key findings include:
Summer drinking peaks the week leading up to the Fourth of July
The month of June has the highest BAC reading across the country
The two highest days for BAC are the Fourth of July at 0.082 and Summer Solstice on June 21. July 3 is right behind at 0.83 BAC.
Eight of the 13 biggest drinking days in the summer are on Saturdays and five days were above the legal limit nationally including June 7, June 14, June 21, July 3, and July 4.
The lowest BAC readings are on Mondays and Tuesdays and drinking subsides the last week in July before picking back up in August.
To read the full report and see the interactive map please click here.
White Plains residents, does anything in this study surprise you? Let us know in the comments section below.
Get more local news delivered straight to your inbox. Sign up for free Patch newsletters and alerts.