Politics & Government
Overloaded Or Underserved? New Public Housing Location Maps
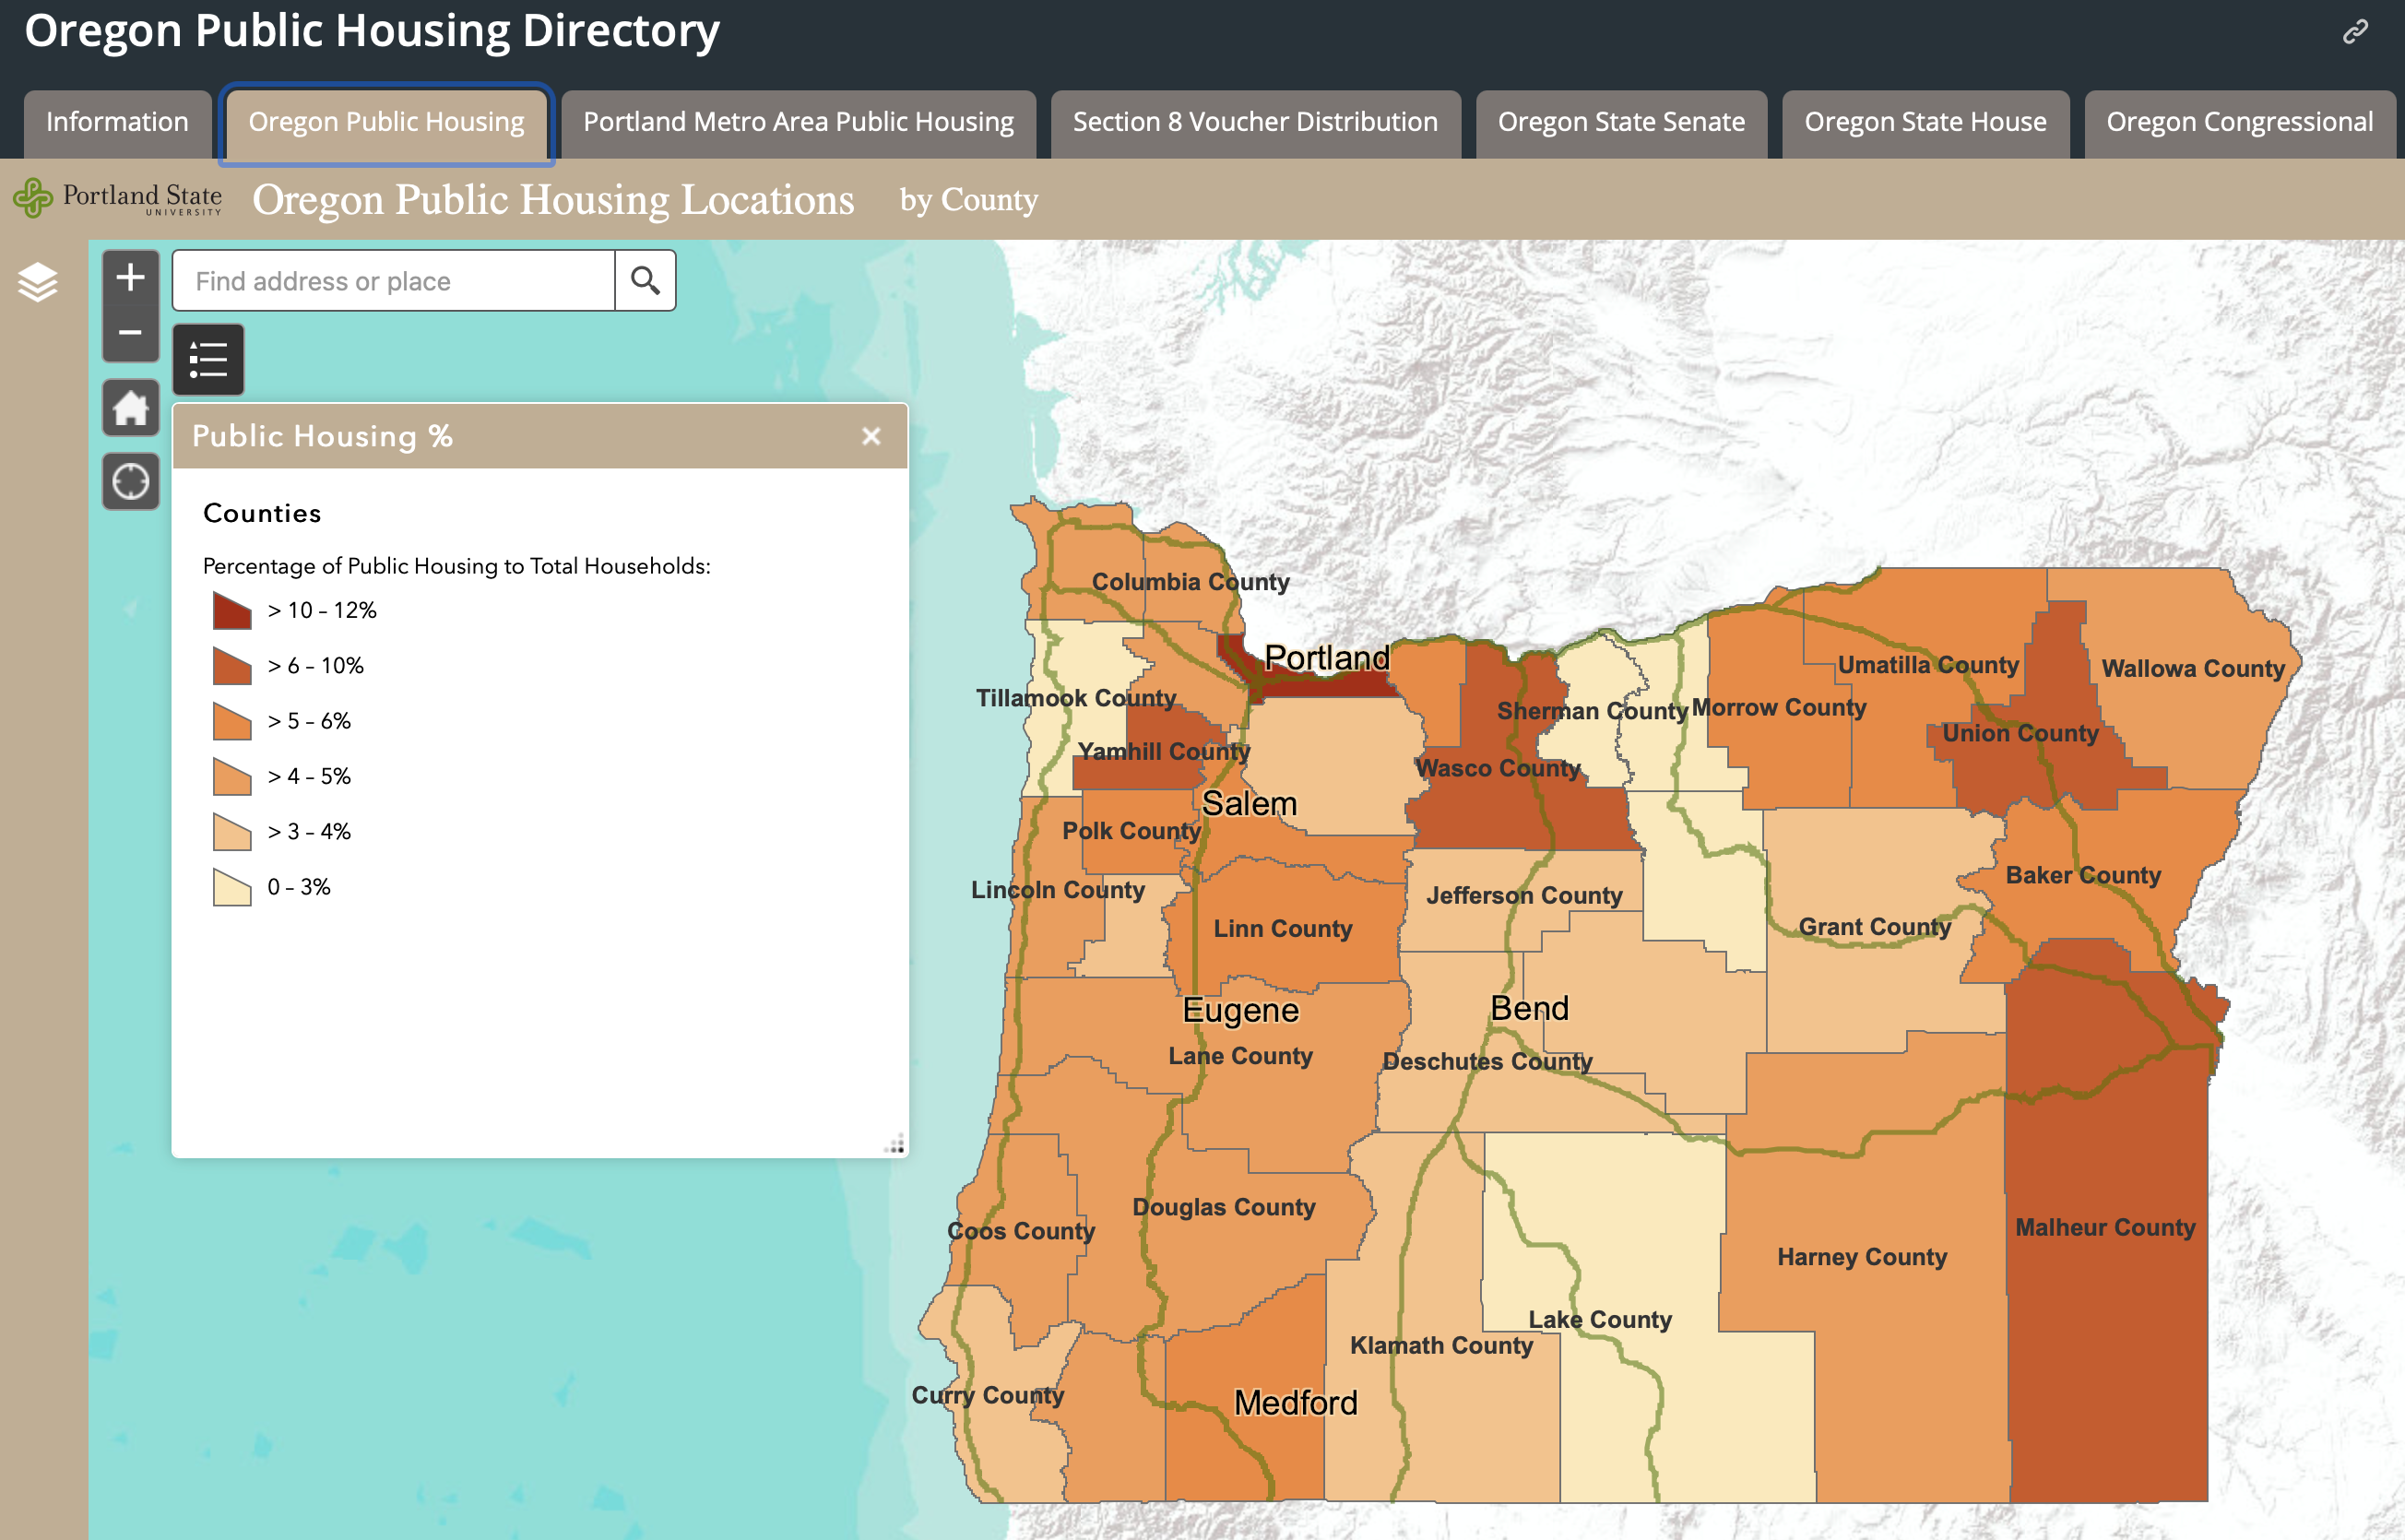
Metro/Oregon Public Housing Location Maps, the first of its kind in Oregon and the United States of America

Hi Fellow Oregonians Et. Al.:
On behalf of the Metro/Oregon Public Housing Location Maps team*1 at Portland Sate University I am proud to announce a significant upgrade to the Metro/Oregon Public Housing Location Maps, the first of its kind in Oregon and the United States of America showing the types, numbers, percentages and locations of Public Housing Units in multiple public jurisdictions throughout Oregon. This enhanced set of interactive maps now includes:
New Data
Find out what's happening in Portlandfor free with the latest updates from Patch.
a) Portland Public Housing Bond Allocations July 2021
b) Metro Public Housing Bond Allocations July 2021
Find out what's happening in Portlandfor free with the latest updates from Patch.
c) Miscellaneous Metro NONSection 8 Units July 2021
d) Miscellaneous State NONSection 8 Units July 2021
e) Section 8 Voucher data incorporated into neighborhood, legislative and congressional districts
f) Clackamas and Washington counties neighborhood overlay spreadsheets August 2021
g) Clackamas and Washington counties neighborhood housing units from 2020 Census August 2021
h) Complete map pop-up data sets for Clackamas and Washington counties neighborhood overlays August 2021
i) Multnomah county neighborhood housing units updated from 2020 Census August 2021
j) All counties Total Housing Units updated from 2020 Census August 2021
New Overlays
a) Five Congressional districts July 2021
b) Ninety Legislative districts July 2021
These maps will be useful to every elected official and citizen of Oregon
Surprising/Provocative Results - See map for details
Congressional district with the highest percentage of Public Housing Units
District 3, Earl Blumenauer - 12.04%
Congressional district with the lowest percentage of Public Housing Units
District 5, Kurt Schrader - 5.12%
State senate districts with the highest percentage of Public Housing Units
District 18, Ginny Burdick - 16.74%
District 22, Lew Fredrick - 16.47%
District 24, Kayse Jama - 13.04%
State senate districts with the lowest percentage of Public Housing Units
District 19, Rob Wagner - 3.31%
District 4, Floyd Prozanski - 3.61%
District 14, Kate Lieber - 3.62%
State house districts with the highest percentage of Public Housing Units
District 36, Lisa Reynolds - 24.92%
District 43, Tawna D. Sanchez - 17.24%
District 44, Tina Kotek - 15.54%
State house districts with the lowest percentage of Public Housing Units
District 27, Sheri Schouten - 1.37%
District 11, Marty Wilde - 1.6%
District 38, Andrea Salinas - 2.4%
Counties with the highest percentage of Public Housing Units
Multnomah - 11.44%
Union - 8.76%
Wasco - 8.36%
Counties with the lowest percentage of Public Housing Units
Wheeler - 0.11%
Gilliam - 1.28%
Lake - 2.22%
Metro counties percentage of Public Housing Units (As a result of Metro’s assertion, with voter approval, that Public Housing is a regional policy issue, Metro is now obliged to achieve parity (6.66%) of Public Housing units among the counties over which it now has Public Housing Location policy authority.)
Multnomah - 11.44%
Washington - 5.08%
Clackamas - 3.45%
Multnomah county neighborhood overlays with the highest percentage i.e. over 20% of Public Housing Units
Old Town - 100.00%
Hazelwood-Mill-Park - 100%
Hollywood - 55.82%
Eastmoreland- Reed - 50%
Portsmouth - 42.67%
Downtown - 40.75%
Madison-South - 35.56%
Humboldt - 31.51%
Eliot - 29.61%
Glenfair - 27.97%
Lloyd-District - 26.25%
Hazelwood - 23.34%
Rockwood - 23.08%
Columbia - 22.41%
Central-City -22.21%
King - 20.93%
Boise - 20.48%
Multnomah county neighborhood overlays with the lowest percentage i.e. ZERO percentage of Public Housing Units
Alameda
Alameda-Beaumont-Wilshire
Alameda-Irvington
Ardenwald-Johnson-Creek
Ardenwald-Johnson-Creek-Woodstock
Argay-Wilkes
Arlington-Heights
Arlington-Heights-Sylvan-Highlands
Ashcreek-Crestwood
Boise-Eliot
Bridgeton
Bridlemile-Southwest-Hills
Centennial-Pleasant-Valley
Collins-View
Cpo-3-Garden-Home-Raleigh-Hills
Crestwood
East-Columbia
Eastmoreland-Ardenwald-Johnson-Creek
Forest-Park-Linnton
Forest-Park-Northwest-District
Goose-Hollow-Southwest-Hills
Grant-Park-Hollywood
Hayden-Island
Healy-Heights-Southwest-Hills
Hillside
Hillside-Northwest-District
Linnton
Lloyd-District-Sullivans-Gulch
Markham
Marshall-Park
Maywood-Park
Mult-Co-Birdshill-Area
Mult-Co-E-Sandy-River-Area
Mult-Co-Englewood-Area
Mult-Co-Interlachen-Area
Mult-Co-Lake-Oswego-Area
Mult-Co-Mt-Hood-Forest-Area
Mult-Co-Riverdale-Area
Mult-Co-Troutdale-Area
Multnomah-Co-Unclaimed-14
North-Troutdale
Northwest-District-Northwest-Industrial
Northwest-Heights
Northwest-Industrial
Palisades
Pleasant-Valley-Powellhurst-Gilbert
Portland-Unclaimed-2
Portland-Unclaimed-5
Riverview-Cemetery-Area
Roseway-Madison-South
Sabin-Irvington
Southwest-Hills
Sullivans-Gulch-Grant-Park
Sunderland
Sweetbriar
Sylvan-Highlands
Sylvan-Highlands-Southwest-Hills
Tryon-Creek-Area
Woodland-Park
Washington county neighborhood overlays with the highest percentage i.e. over 20% of Public Housing Units
East-Tualatin - 64.10%
Riverpark - 24.72%
Washington county neighborhood overlays with the lowest percentage i.e. ZERO percentage of Public Housing Units
Cpo-1-Cedar-Hills-Cedar-Mill-N
Cpo-1-Cedar-Hills-Cedar-Mill-S
Cpo-15
Cpo-3-Garden-Home-Raleigh-Hills
Ibach
Midwest
West-Slope
Clackamas county neighborhood overlays with the highest percentage i.e. over 20% of Public Housing Units
Caufield - 26.94%
Clackamas county neighborhood overlays with the lowest percentage i.e. ZERO percentage of Public Housing Units
Barlow
Beavercreek
Bht
Birdshill
Blue-heron
Bolton
Bryant
Bull-Run-Community-Association
Canemah
Carver-Logan
Childs
Clackamas-Co-Unclaimed-4
Clackamas-Co-Unclaimed-5
Clarkes-Highland
East-Tualatin
Evergreen
Firwood-Neighbors
Foothills
Forest-Highlands
Glenmorrie
Grant-Park
Hallinan
Hazel-Grove-Westling-Farm
Hidden-Springs
Holly-Orchard
Island-Station
Johns-Woods
Johnson-City
Lakeview-Summit
Lakewood
Mcloughlin-Industrial
Mcvey-South-Shore
North-Shore-Country-Club
Old-Town
Other
Parker-Crest
Rhododendron
Rivercrest
Rivergrove
Rock-Creek
Rosemont-Summit
Savanna-Oaks
Skylands
Skyline-Ridge
Tower-Vista
Two-Rivers
Uplands
Westlake
Westridge
Milwaukie-1
Is YOUR congressional district, state legislative senate district, state legislative house district, county/city/neighborhood OVERLOADED or UNDERSERVED with Public Housing?
The Metro/Oregon Public Housing Location Maps will help give you an answer.
The purpose of this map is to provide a common touchstone of Public Housing Location Data. Elected officials and all Oregonians can use these maps to discuss, debate and decide on the best, reasoned, defensible, equitable policy decisions related to Public Housing locations in Oregon.
We can NOT have a credible, fact based public debate with defensible arguments for or against any Public Housing Policy without credible data. Now we Oregonians, all of us, have it. In fact, it gets better than that. We also have easy to understand interactive maps that visually tell us the story of Public Housing Locations within multiple level political and governmental jurisdictions in our Oregon.
The Oregon Housing and Community Services department and other county housing authorities have identified approximately 110,688 Public Housing households connected to Public Housing Authorities and related agencies in the state of Oregon. All of these households meet the following criteria: PUBLIC HOUSING i.e. a class of housing defined as, Means Test (<=80%MFI) + Government Subsidy (any government any type) + Rental Agreement.
There is no publicly available evidence that any of these 110,688 Public Housing households are currently occupied by households that meet the following criteria: AFFORDABLE HOUSING is a mathematical construct defined as, Rent/Mortgage + Insurance + Taxes + Utilities <=30% Household Income.
Research has revealed that most Public Housing is NOT Affordable Housing.
Government is in the Public Housing business NOT the Affordable Housing business.
Metro/Oregon Public Housing Location Maps Enable Equity, Parity, NIMBY Debate
Equity. Parity. NIMBY. These terms can and should be considered with every decision to spend public funds on Public Housing throughout Oregon. Where Public Housing is located has not been a consideration in the placement of Public Housing because there was no authoritative source that all parties could use as a common factual basis. The Metro/Oregon Public Housing Location Maps will make these conversations and decisions possible.
We hope that after examining the Metro/Oregon Public Housing Location Maps and the included data files you will be motivated to ask yourself and your elected officials questions like the following:
A. Which policy is more dominant among and within Oregon counties, Equitable Distribution of Public Housing OR Targeted, UNLIMITED neighborhood/city/county/legislative district concentration of Public Housing?
B. Do you see parity of Public Housing locations among Oregon’s counties, the Metro Regional Government counties and Multnomah, Washington and Clackamas county neighborhoods, Oregon’s legislative and congressional districts?
C. How do we explain/justify the percentage range of Public Housing units to total housing units within Multnomah county neighborhoods from zero to 100%?
D. How do we explain/justify the percentage range of Public Housing units to total housing units within Metro’s three counties from 3.45% to 11.44%?
E. How do we explain/justify the remarkable number of neighborhoods under the Metro regional government’s Public Housing Policy Jurisdiction, i.e. 119, that have ZERO public housing units?
F. How do we explain/justify the percentage range of Public Housing units to total housing units within all Oregon counties from 0.11% to 11.44%?
G. How do we explain/justify the percentage range of Public Housing units to total housing units among all House districts from 1.37% to 24.92%?
H. How do we explain/justify the percentage range of Public Housing units to total housing units within all Senate districts from 3.31% to 16.74%?
Wildfires, pandemic and eviction repercussions coupled with huge increases in funding for Public Housing from all government levels must put Public Housing location decision making high up on many Oregon government agendas. Their location decisions can and will have a dramatic effect on their constituencies. These debates and decisions must all begin with the question:
Is YOUR congressional district, state legislative senate district, state legislative house district, county/city/neighborhood OVERLOADED or UNDERSERVED with Public Housing?
Please feel free to copy and past the map image above or this URL, https://www.goodgrowthnw.org/m..., to public jurisdiction web sites or other places where interested citizens can easily find it.
Thank you for your interest. Enjoy the exploration.
Send comments to Richard Ellmyer<ellmyer@pdx.edu>
Richard Ellmyer
Author of more stories on the politics, players and policies of Public Housing in Oregon over the last twenty years than all other journalists and elected officials combined.
https://www.goodgrowthnw.org/m...
Author of The Ellmyer Report, a newsletter that informs, educates and influences on public policy. Occasionally distributed to more than a quarter of million readers in Oregon and beyond. Facebook, Portland Politics Plus . Contributor: Patch news
*1 Who’s Responsible And Deserves Credit For This Public Service? The Metro/Oregon Public Housing Location Maps Team
Claire Brumbaugh-Smith - Portland State University Masters Degree Program, Project Primary GIS Analyst and Cartographer
Taylor Allen - Portland State University graduate, Former Project Primary GIS Analyst and Cartographer
Richard Ellmyer - Portland State University Senior Adult Learner, Project Champion and Data Wrangler
Randy Morris - Community GIS Project Leader Population Research Center Portland State University, Project Coordinator
*/ /*-->*/