Schools
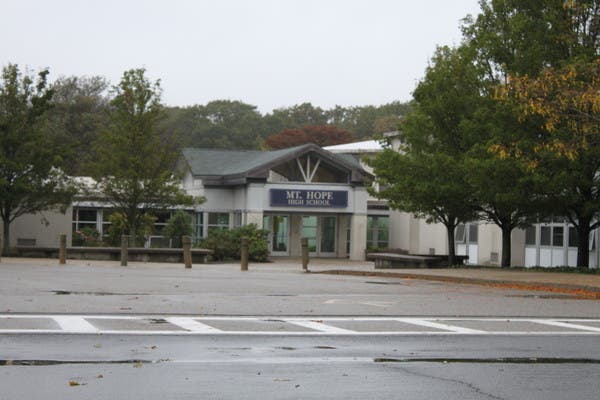
Mount Hope Ranks 12th in State
U.S. News and World Report ranked the regional high school 12th among 59 Rhode Island public and charter high schools that qualified for the list.

is the 12th ranked high school in Rhode Island and has received national recognition, according to U.S. News and World Reports' Best High School List.
Mount Hope ranked at or above state averages in every key indicator the magazine used in compiling its rankings of nearly 22,000 high schools in 49 states and the District of Columbia. The school's 12:1 student-to-teacher ratio and college readiness (measured by the number of students who took and passed AP exams) are at state averages. Sixteen percent of students took the exam; 13 percent passed, the magazine reports.
In creating its list, U.S. News and World Report relied heavily on standardized test results. Mount Hope met state averages in math with 34 percent of students deemed proficient in math; 66 percent not proficient. Reading results gave the school a boost, as 86 percent of student measured proficient, and just 14 percent were deemed not proficient.
Find out what's happening in Bristol-Warrenfor free with the latest updates from Patch.
The top school in the state — — registered scores of 66 percent proficient in math; 95 percent proficient in reading.
The publication used a three-step process to determine its list of the best high schools. The first two steps ensured that the schools serve all of their students well, using performance on state proficiency tests as the benchmarks. For those schools that made it past the first two steps, a third step assessed the degree to which schools prepare students for college-level work.
Find out what's happening in Bristol-Warrenfor free with the latest updates from Patch.
The first step determined whether each school's students were performing better than statistically expected for the average student in the state. Researchers started by looking at reading and math results for all students on each state's high school proficiency tests. They then factored in the percentage of economically disadvantaged students (who tend to score lower) enrolled at the school to identify the schools that were performing better than statistical expectations.
The second step determined whether the school's least-advantaged students (black, Hispanic, and low-income) were performing better than average for similar students in the state. The magazine compared each school's math and reading proficiency rates for disadvantaged students with the statewide results for those student groups and then selected schools that were performing better than the state average.
Schools that made it through the first two steps were eligible to be judged nationally on the final step — college-readiness performance — using Advanced Placement or International Baccalaureate test data to determine success, depending on which program was largest at the school.
This third step computed a "college readiness index" based on the percentage of students who took and passed the AP exams to identified schools that recorded the best college-level achievement for the highest percentages of their students.
Get more local news delivered straight to your inbox. Sign up for free Patch newsletters and alerts.