Schools
School Report Cards Released Tuesday: Here Is How Greenfield Did
We have results from every school in Greenfield. There were several star performers this year.


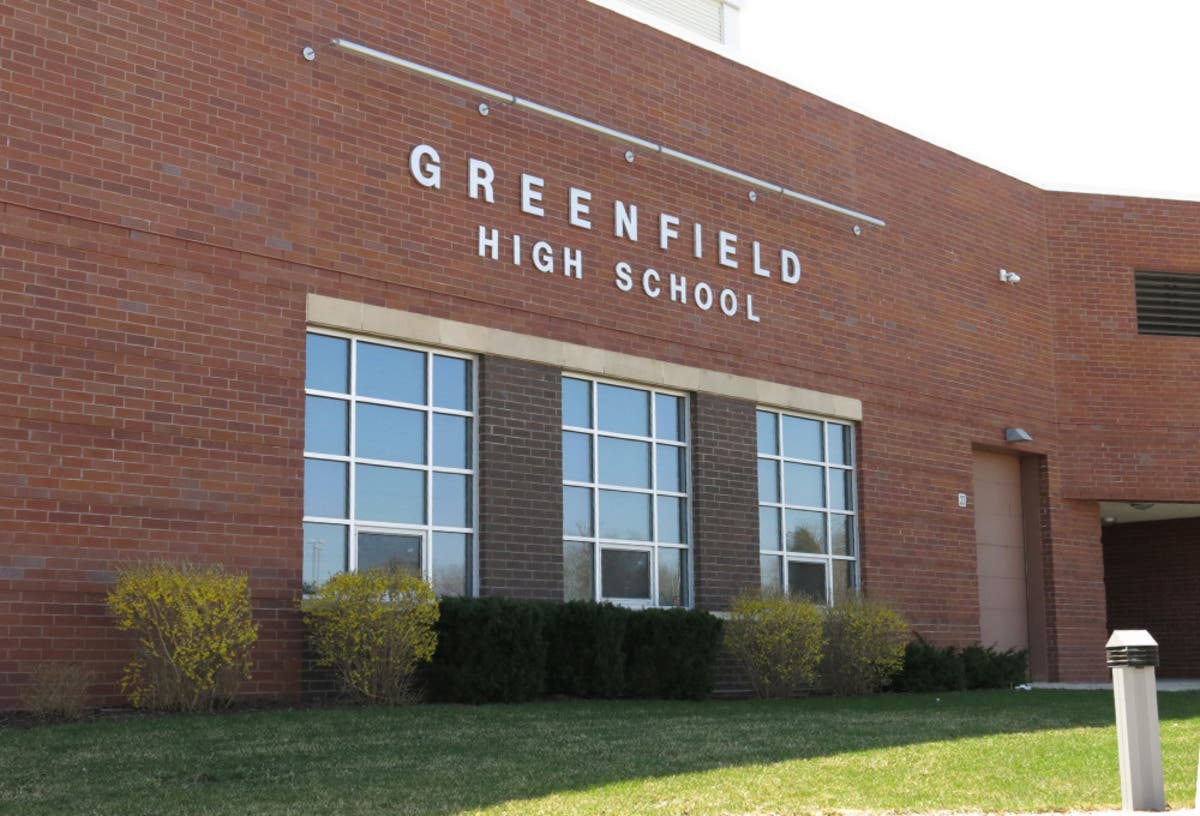
GREENFIELD, WI — School report cards released Tuesday by the State Department of Public Instruction show that the Greenfield School District "meets expectations."
Scores are calculated for each of the following priority areas on the state report card:
• Student Achievement proficiency in English Language Arts (ELA) and mathematics on state assessments
• Student Growth measured by year-to-year improvements in achievement
• Closing Gaps in performance between specific student groups (comparing English language learners, low-income students, students with disabilities, and members of a racial or an ethnic group with their peers)
• On-Track and Postsecondary Readiness is a measurement using reliable predictors of high school graduation and potential post high school success

District
Greenfield 69.4 Meets Expectations
Find out what's happening in Greenfieldfor free with the latest updates from Patch.
Schools
Meets Few Expectations (1)
Greenfield High 61.7 Meets Few Expectations
Find out what's happening in Greenfieldfor free with the latest updates from Patch.
Meets Expectations (2)
Maple Grove Elementary 67.7 Meets Expectations
Greenfield Middle 69.1 Meets Expectations
Exceeds Expectations (3)
Elm Dale Elementary 77.3 Exceeds Expectations
Edgewood Elementary 79.9 Exceeds Expectations
Glenwood Elementary 82.3 Exceeds Expectations
Significantly Exceeds Expectations (0)
All Wisconsin Districts Get Passing Grade
Overall, 361 public and private school report cards earned five-star ratings, 719 had four stars, 643 had three stars, 261 had two stars, and 117 schools earned one star. On district level report cards, 44 districts earned five-star ratings, 190 had four stars, 166 earned three stars, and 20 had two stars.
There were 152 report cards for 140 private choice schools that are not rated because there was insufficient data. This is the second year that choice schools were included in report cards and the second year the schools could opt to have both a choice student and an all student report cards.

How Report Cards Are Calculated
Accountability ratings are calculated on four priority areas: student achievement in English language arts and mathematics, school growth, closing gaps between student groups, and measures of postsecondary readiness, which includes graduation and attendance rates, third-grade English language arts achievement, and eighth-grade mathematics achievement.
Schools and districts could have point deductions for missing targets for student engagement: absenteeism must be less than 13 percent and dropout rates must be less than 6 percent.
The 2016-17 report cards use data from a variety of sources, including information reported through WISEdash and two years of Forward and one year of Badger testing as well as three years ACT Plus Writing and Dynamic Learning Maps testing for growth calculations.
Image Via Patch.com File Photo
Get more local news delivered straight to your inbox. Sign up for free Patch newsletters and alerts.