Politics & Government
District Elections Are Coming - Take a Look
Preliminary maps are available online.

District Elections draft maps are now available online for the public to view and provide input. Share your thoughts with Council about which map(s) you like or dislike and why you feel that way about each map. These are the first drafts, not necessarily the final maps, and future versions can include revisions aimed at addressing the concerns raised by residents. Head over to the website at the link below and check out each draft plan with links to Adobe PDF maps and PDF demographic profiles. City Council will consider public comments at the upcoming Public Hearing scheduled for 6:30 p.m. on Tuesday, October 3rd. As a reminder, you can still draw your own revisions to any of the posted Draft Maps.
12 maps survived the cut by the consulting demographers and those are the maps analyzed next .
Find out what's happening in Lake Forestfor free with the latest updates from Patch.
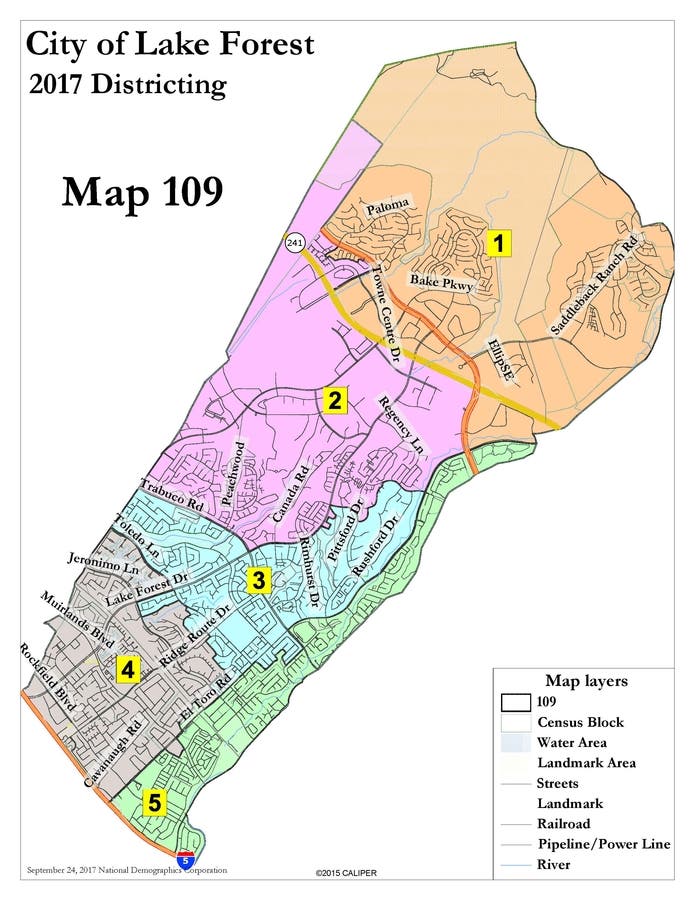
(Note: I highlighted 2 of those maps in this article. Map #109 had the fewest deviations from perfect alignment and Map #105 had the largest deviation.)
ONE PERSON ONE VOTE
The federal government requires "one person one vote". No one district should have any more or less people than the other districts, however, evenly dividing the population up into 5 districts isn't easy and no one map achieved perfect representation.
Find out what's happening in Lake Forestfor free with the latest updates from Patch.
Three maps had fewer than 150 deviations from perfect alignment. Another 5 maps had between 606 and 960 people outside the perfect alignment mandate, and 4 more had more than 1,000. Here's the data.
Deviations from perfect alignment
- 110 - Map #109 (accompanies this article)
- 135 - Map #108
- 145 - Map #110
- 606 - Map #106
- 698 - Map #114
- 819 - Map #103
- 919 - Map #127
- 960 - Map #112
- 1082 - Map #116
- 1114 - Map #111
- 1302 - Map #115
- 1530 - Map #105 (accompanies this article)
Another way of looking at data is to see which maps had the greatest deviations for any one district. The previous analysis looked at total deviations overall. This analysis looks to see the worst case scenario.
Worst Case Scenario
- 60 - Map #109 (accompanies this article)
- 83 - Map #108
- 77 - Map #110
- 356 - Map #106
- 433 - Map #114
- 448 - Map #103
- 471 - Map #127
- 552 - Map #112
- 599 - Map #116
- 591 - Map #111
- 692 - Map #115
- 838 - Map #105 (accompanies this article)
The data here (worst case) resembles, but doesn't equal, the previous data (total). For example, Map #110 had the second lowest total deviation but the third lowest worst case scenario. But generally speaking, the two lists are highly correlated because they are inter-related.
CONCLUSION
Using the "one person one vote" guideline, 3 maps stood out with fewer than 150 deviations from perfect alignment. No other maps came even close, although the next set of maps had relatively small deviations when you consider the population and the nature of the task.
Tomorrow we'll consider the "communities of interest" and the extent to which maps maintained communities intact.
ABOUT THE AUTHOR
Dr. Jim Gardner is on the City Council for Lake Forest. You can check him out on LinkedIn and/or Facebook and you can share your thoughts about the City at Lake Forest Town Square on Facebook. His comments are not meant to reflect official City Policy.
Dr. Gardner has office hours every Tuesday from 4 pm to 6 pm at the City Hall. In addition, he holds a mini town meeting every quarter. The next meeting will be on Dec 2 at 2 pm at the El Toro Public Library.