Politics & Government
District Elections - The Final 5
Which map conforms best to "one person one vote"


Meeting on Oct 3, the City Council selected 4 maps and commissioned another to be created. Here are the 5 maps and details about each of them. The Council will meet on Nov 7 to make a final choice.
ONE PERSON ONE VOTE
The single most important consideration in selecting a map is that the districts be of equal size. No map achieved perfect alignment, but they did vary a lot, and here are the total deviations for each of the maps. The map with the lowest number is the one that most approaches perfect alignment and conformity to the one person one vote mandate.
- Map #109 – 110
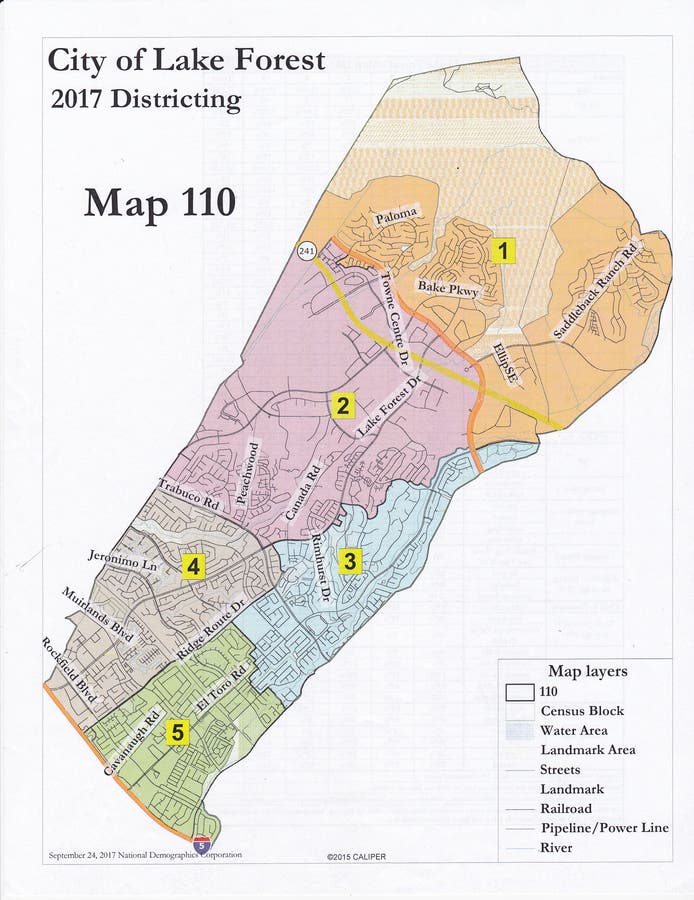
- Map #110 – 145
- Map #128 - 860
- Map #116 – 1,082
- Map #115 – 1,302
By way of explanation, Map #109 had a mere 110 people out of alignment when spread out over the 5 districts and the 77,264 people involved. That's less than a 1% error rate. Map #115, on the other hand, had 1,302 people out of alignment for an error rate of 8.43%.
Find out what's happening in Lake Forestfor free with the latest updates from Patch.
Another way to look at the data, in addition to total deviations, is the largest deviation present in any one district. Here is that number. Once again, smaller is better.
- Map #109 – 60
- Map #110 – 77
- Map #128 - 486
- Map #116 – 599
- Map #115 – 692
Not surprisingly, the rank order for total deviations is identical to single district discrepancies. The magnitude of difference between the best (#109) and the worst (#115) is more than 10 xs in each case.
Find out what's happening in Lake Forestfor free with the latest updates from Patch.
COMMUNITIES OF INTEREST
I identified 8 “communities of interest” that are impacted by the districts -
- Lake 1 HOA
- Lake 2 HOA
- The Lakes (homes surrounding the lakes in Lake 1 and 2)
- The Woods (West of Serrano to the Railroad tracks, between LF Drive and just south of Ridge Route)
- Foothill Ranch
- Portola Hills
- Creekside homes (East of Trabuco, South of El Toro)
- Mobile Park Homes
All told, these 8 communities have about 40,000 people, which is more than half the number of people from the 2010 census.
Four of these communities have identifiable natural boundaries (Foothill Ranch, Portola Hills, Creekside homes, the “Lakes”)
Let’s examine the extent to which each of these communities of interest are treated by the 5 maps selected.
LAKE 1 HOA
- Map #109 is the only map to keep Lake 1 HOA intact.
- Map #116 keeps Lake 1 intact above Muirlands, but takes the homes below Muirlands and puts them in another district. That’s about 1,000 people of the 5,000 in Lake 1 HOA.
- Map #115 cuts Lake 1 nearly in half at the railroad tracks. It puts about 1,000 people into District 3 (with Lake 2), and about 1,000 into District 4 (with Creekside and Bennett Ranch)
- Map #110 divides Lake 1 using Ridge Route, dividing it in half with about 2500 people joined with Lake 2.
- Map #128 divides Lake 1 in half and ends up putting it into 3 different districts.
LAKE 2 HOA
- Maps #110 and #115 leave Lake 2 nearly intact, taking away a small portion South of Ridge Rte.
- Map #109 leaves Lake 2 mostly intact, carving off the homes around the lake in Lake 2 to combine with the lake in Lake 1, making a “community of interest” among lake dwellers.
- Map #116 cuts Lake 2 nearly in half using Lake Forest Drive,
- Map #128 divides Lake 2 in half and ends up putting it into 3 different districts.
THE LAKES
- Maps #109 and #110 kept the lakefront homes in one district
FOOTHILL RANCH/PORTOLA HILLS
- Maps #115 and #128 split FHR and PH into two different districts. #128 actually splits FHR into two more districts.
- The other maps combine PH and FHR, but to reach the ideal alignment, about 1,000 homes are separated and joined with another district, leaving FHR about 90% intact.
CREEKSIDE HOMES
- Map #109, #110, and #128 keep the Creekside homes intact
- Map #115 keeps Creekside mostly intact, cutting off the piece west of Creekside Drive
- Map #116 cuts the Creekside homes nearly in half, beginning slightly west of Vintage Park.
MOBILE HOMES
- Map #128 kept all 4 mobile home parks in the same district.
- All the other maps had 3 of the mobile homes in one district, but the fourth mobile home park in a different district.
THE WOODS
- Map #110, #128, #116 and #115 kept the woods area intact.
- Map #109 kept most of the woods area intact, but cut off a small piece below Toledo
SUMMARY
Maintaining the lowest number of deviations from perfect alignment is the single most important attribute for a map, and fortunately the data here are actual numbers, leaving no room for interpretation. “Communities of interest”, on the other hand, are not so easily defined and not so easily measured, and sometimes we have communities of interest that are in conflict with each other. For example, in keeping “the woods” homes together a map must break up Lake 1 and Lake 2 because “the woods” exist in both places. Is it more important for “the woods” homes to be kept together if it means breaking up the HOAs? Not an easy question to answer.
In the recent past I conducted several polls using Lake Forest Town Square to assess the extent to which residents wanted their communities of interest intact or split. I did separate surveys for Lake 1, Lake 2, and FHR and PH. In all cases, the overwhelming majority of people wanted their communities kept intact.
Tomorrow we’ll continue our analysis.
ABOUT THE AUTHOR
Dr. Jim Gardner is on the City Council for Lake Forest. You can check him out on LinkedIn and/or Facebook and you can share your thoughts about the City at Lake Forest Town Square on Facebook. His comments are not meant to reflect official City Policy.
Dr. Gardner has office hours every Tuesday from 4 pm to 6 pm at the City Hall. In addition, he holds a mini town meeting every quarter. The next meeting will be on Dec 2 at 2 pm at the El Toro Public Library.