This is the fourth in a multi-part series about homelessness. Previously we noted that
- Homelessness changes depending on your definition, from very narrow to very broad.
- There are three main groups of homeless people – (1) people who chose to be homeless, (2) people whose disabilities create/contribute to homelessness, and (3) people who experience a major negative event which propels them into homelessness.
- The life style homeless basically want to be left alone. The temporary homeless are looking for help to return them to their normal life. The chronic homeless have such disabling conditions they are the most difficult to reach and to help.
- In recent years, a greater percent of the homeless are coming from the temporary group, fueled largely by the high cost of housing in relationship to their income.
- The commonly used federal survey under –estimates the number of homeless. In reality, there are over a million homeless people nationwide, 250,000 in California and between 10,000 and 15,000 in Orange County.
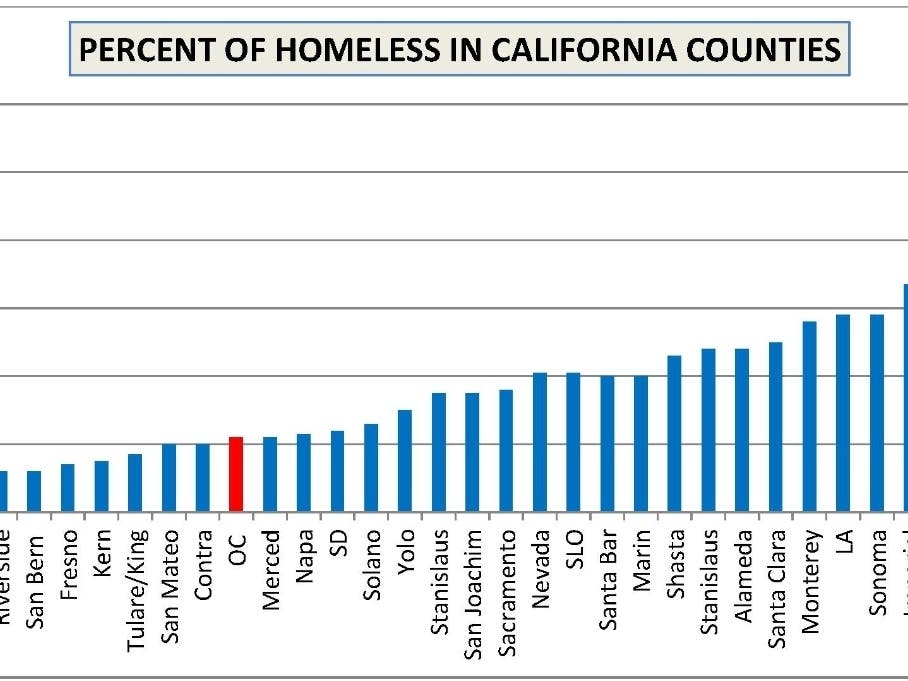
Today we’ll get some perspective, looking at how Orange County compares to the rest of the State. The graph referred to in this report accompanies the article.
This report looked at the data from 39 California counties that account for more than 97% of the California population. Only counties with 100,000 or more people were examined. Population data was taken from U.S. Census estimates for 2018. Almost all the homeless population data is from 2019 but some is from 2017 (Fresno/Madera) or 2018 (Napa).
Find out what's happening in Lake Forestfor free with the latest updates from Patch.
California counties allow themselves a very broad interpretation of what should go into a PIT survey, how the data should be collected and displayed. Therefore, not every county has data on every dimension being studied. As already noted, PIT counts are subject to errors, especially under-counting, however, since all the data comes from PIT surveys, we can assume that the problems balance across the counties, allowing meaningful comparisons.
What Percent of OC is Homeless?
With slightly more than 0.22% of the population homeless, OC occupies the lower range for 32 California counties which go from 0.08% (Ventura) to 1% (Butte) with an average of 0.39%. According to HUD, the national average is estimated at 0.5%.
Find out what's happening in Lake Forestfor free with the latest updates from Patch.
There are no common factors identifying why one county vs. another has a high percent of homeless people. Here is a rank order of the top 10 most populous counties and their rate of homelessness –
- Los Angeles – 0.58
- San Diego – 0.24
- Orange – 0.22
- Riverside – 0.11
- San Bernardino – 0.12
- Santa Clara – 0.50
- Alameda – 0.48
- Sacramento – 0.36
- Contra Costa – 0.20
- Kern – 0.15
There is no pattern. Nor is density a factor. Here are the top 10 most dense counties along with the percent of homeless –
- Orange – 0.22
- Los Angeles – 0.58
- Alameda – 0.48
- Contra Costa – 0.20
- Sacramento – 0.36
- Santa Clara – 0.50
- San Diego – 0.24
- Marin – 0.40
- Ventura – 0.20
- Stanislaus – 0.35
Once again, there is no pattern. Whether or not a county has more or fewer homeless people as a percent of population doesn’t seem related to population or density.
People sometimes argue that the cost of housing is a major cause of homelessness. Here are the top California counties for homelessness along with the percent of median household income that goes toward median annual rent. Data is taken from the Department of Numbers.
- Butte – 24.46%
- San Francisco – 19.88
- Santa Cruz – 25.29%
- Imperial – 21.02%
- Sonoma – 23.98%
- Los Angeles – 25.88%
- Monterey – 24.7%
- Santa Clara – 22.47%
- Alameda – 21.75%
- Stanislaus – 22.91%
- Butte – $1,000
- San Francisco – $1,836
- Santa Cruz – $1,680
- Imperial – $827
- Sonoma – $1,607
- Los Angeles – $1,402
- Monterey – $1,467
- Santa Clara – $2,229
- Alameda – $1,745
- Stanislaus – $1,136
Once again, the percent of homeless people living in a county has no pattern with reghard to the cost of housing.
Looking merely at median gross rent, without taking into consideration the household’s income, here is the data –
Once again, no pattern.
Summary
There is a wide difference in the percent of the population in California counties who are homeless, and the extent is not determined by population, density, nor the rent nor the cost of housing as a percent of income. Homelessness appears idiographic. In Orange County our percent of homeless is 22 per 10,000 people, which is below average for the State.
Next time we’ll get some statewide perspective on the unsheltered homeless people.
About the Author
Dr. Jim Gardner is the former Mayor of Lake Forest. A Clinical Psychologist, he is a former University Professor and Department Head. He authored several reports about homelessness.