
This is the ninth in a multi-part series about homelessness. Previously we noted that
- Homelessness changes depending on your definition, from very narrow to very broad.
- There are three main groups of homeless people – (1) people who chose to be homeless, (2) people whose disabilities create/contribute to homelessness, and (3) people who experience a major negative event which propels them into homelessness.
- The life style homeless basically want to be left alone. The temporary homeless are looking for help to return them to their normal life. The chronic homeless have such disabling conditions they are the most difficult to reach and to help.
- In recent years, a greater percent of the homeless are coming from the temporary group, fueled largely by the high cost of housing in relationship to their income.
- The commonly used federal survey under –estimates the number of homeless. In reality, there are over a million homeless people nationwide, 250,000 in California and between 10,000 and 15,000 in Orange County.
- There is wide diversity among California counties in the percent of the population who are homeless. Orange County at 0.22% (22 homeless people for every 10,000 residents) is mid low range with an average of 0.39% for the State.
- There is wide diversity among California counties in the percent of the homeless population who are unsheltered. Orange County at 58% is mid low range with an average of 65.3% for the State.
- There is wide diversity among California counties in the percent of the homeless who self-report being mentally ill. Orange County at 28% is mid range with an average of 29.5% for the State.
Today we’ll get some perspective, looking at the change in the number and percent of homeless people who report being mentally ill.
Is the Percent of Mental Illness Among Homeless in OC Changing?
Changes in Mental Illness Among Homeless
Find out what's happening in Lake Forestfor free with the latest updates from Patch.
Generally speaking, from year to year, there aren’t many changes in the number and percent of homeless people who self-report being mentally ill. According to HUD, from 2013 to 2018 inclusive the percent varied between 18% and 20% nationwide, and in California, it varied between 25% and 28%. These are remarkably stable figures. Year-to-year percent changes most often have been 0. In terms of absolute numbers, nationwide the range was 104,083 to 117,764 and in California the range was 29,496 to 34,673 with no discernible trends.
Changes in OC
Find out what's happening in Lake Forestfor free with the latest updates from Patch.
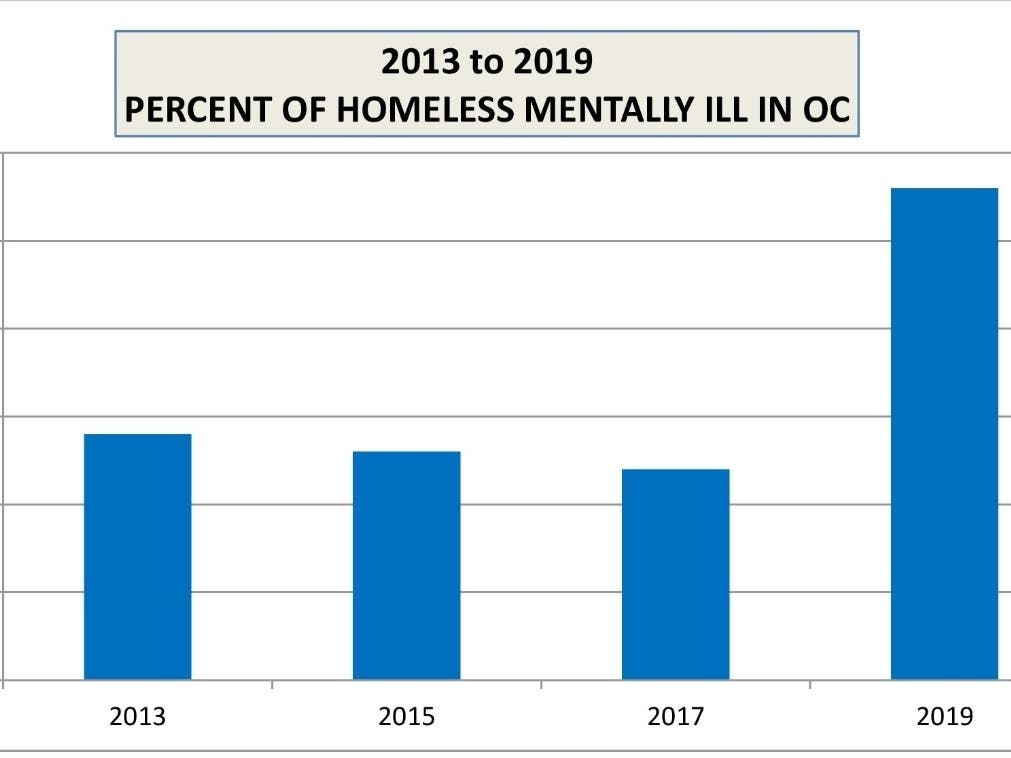
According to the 2019 OC PIT survey, 28% of homeless adults self-reported “serious mental illness”. This rate is substantially higher than previous PIT surveys in OC that reported rates of “serious mental illness” at 12% to 14% (see graph accompanying this article) for adults. The difference in numbers is enormous. In the surveys from 2013 to 2017 there were less than 500 homeless mentally ill people in OC. In 2019 the figure jumped to more than 1,600 (see graph). If all the surveys are to be believed, this means the proportion of homeless people with “serious mental illness” in OC has at least doubled in the past two years and the number has more than tripled. In contrast, in more than half of the California counties the percent of homeless who self-reported being “mentally ill” has decreased (see graph).
OC was not alone in showing an increase in the percent of homeless people who self-reported mental illness: 10 other counties had an increase. For the 11 counties, the average increase was 42%. For the 18 counties showing a decrease, the average decrease was -21.5%. Two counties (Sonoma, San Francisco) showed no change. For all 31 counties the average change was 2.4%. With an increase of 133%, OC leads the pack and is many more times the 2.4% average change for the counties that provided data.
According to HUD the percent of homeless people in California who were “severely mentally ill” from 2013 through 2018 was steady at 25% to 28% with an average year-to-year change of 0.8%. On a nationwide basis, the percent was between 18% and 20% with an average year-to-year change of 0.8%.
The overall change in 2019 for California counties of 2.4% is in-line with the HUD figures for California as a whole, however, the change in OC (133%) is clearly out of line.
The increase in OC from 2017 to 2019 was so large that it required a comparison of the changes in the percent of homeless mentally ill from 2015 to 2017 as well. Looking at that data, the range of change for individual counties was +51.3% (Placer) to -34.5% (Contra Costa) with an average change of -0.36%. Regardless of whether the comparison is 2017 vs. 2019 or 2015 vs. 2017 vs. 2019, OC stands out.
Summary
Orange County has experienced an increase in the percent of the homeless who self-report being mentally ill, and that increase (more than double) is out of proportion to any other increases in any other counties. This increase is particularly worrisome when you consider the fact that more than half the California counties had a decrease in the percent of mentally ill homeless. How the heck did this happen? That will be our next topic.
About the Author
Dr. Jim Gardner is the former Mayor of Lake Forest. A Clinical Psychologist, he is a former University Professor and Department Head. He authored several reports about homelessness.