

According to the demographer, 12 maps made the cut for final consideration. Here are some of the maps submitted and comments about each of them.
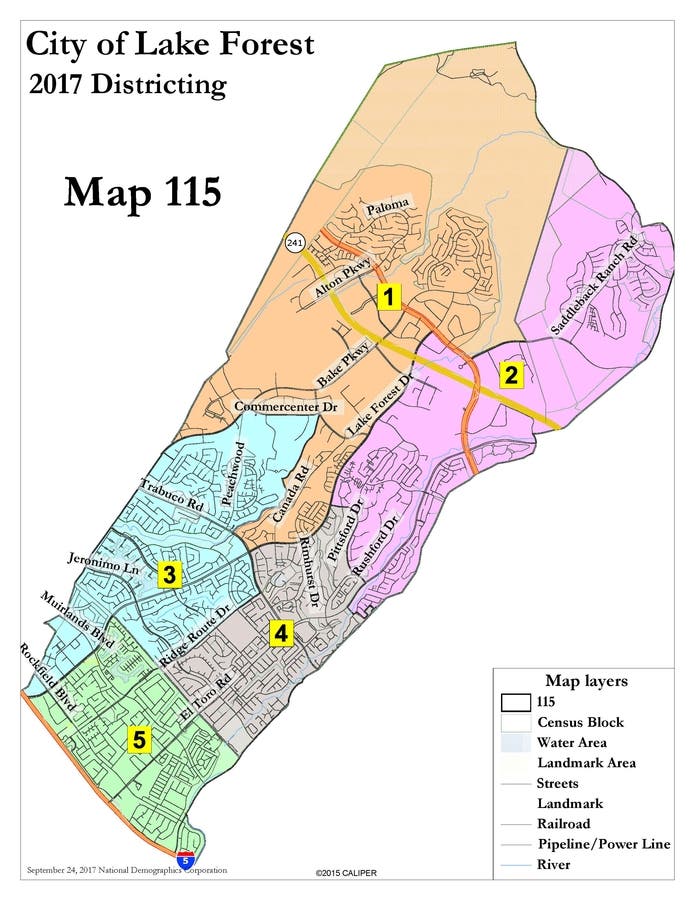
Map #115
This map breaks up every single "community of interest" and "natural boundary" in the City. Lake 1, Lake 2, the mobile homes, the creekside homes, and Portola/Foothill Ranch are all broken up into separate districts. Maps #116, 114, 103, and 105 also do the same.
In addition to breaking up all communities and boundaries, this map has 1302 deviations from perfect alignment. Only one other map (#105) had a worse score.
Find out what's happening in Lake Forestfor free with the latest updates from Patch.
Map #111
This is the only map to combine all mobile home parks into one district. Other than that, this map breaks up FHR and PH, creekside, Lake 1 and Lake 2. In terms of perfect alignment, it has 1114 total deviations, making it the 3rd worst mpa in terms of complying with the "one person one vote" mandate.
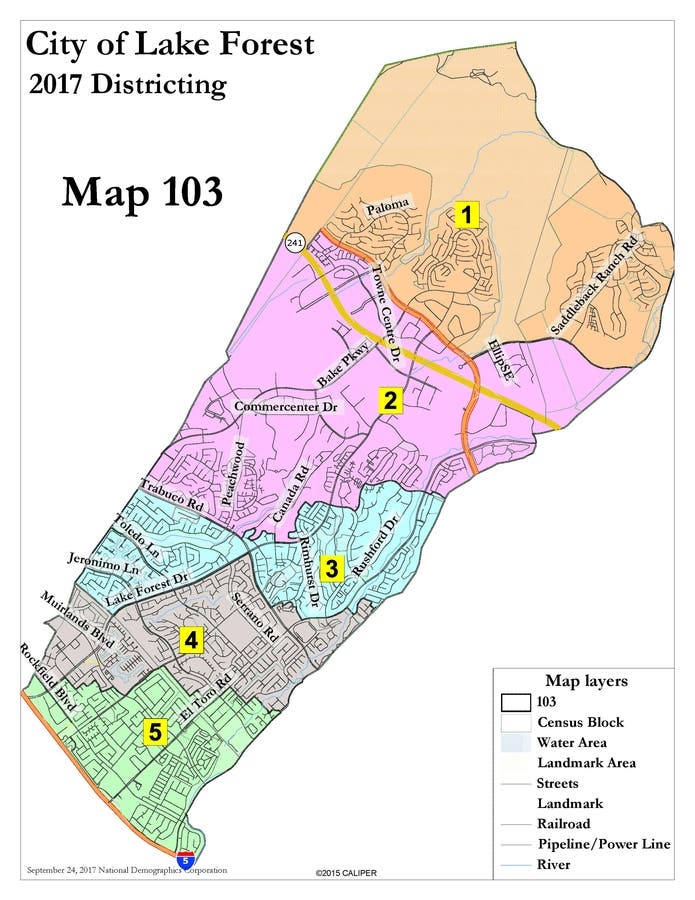
Map #103
This is the funniest shape of all maps, creating an hourglass in the middle of the city. It breaks up Lake 1 and Lake 2, the creekside homes. It has 819 total deviations from the perfect alignment, making it the 6th worst map in terms of meeting "one person one vote" mandate.
Find out what's happening in Lake Forestfor free with the latest updates from Patch.
Map #109
This map had the least deviation from perfect alignment - a mere 110 people. It managed to keep FHR/PH in tact along with the creekside homes and Lake 1. The only communities of interest it broke up were the mobile homes and Lake 2, and it did that by combining the lake front homes in Lake 1 and Lake 2 into one district - something no other map did.
To see all the maps, Click Here