Politics & Government
Pre-Fire Palisades Ranked No. 1 In LA County For Overall Wellbeing: Study
A new county-funded study found that Pacific Palisades had the highest human development index score in LA County.

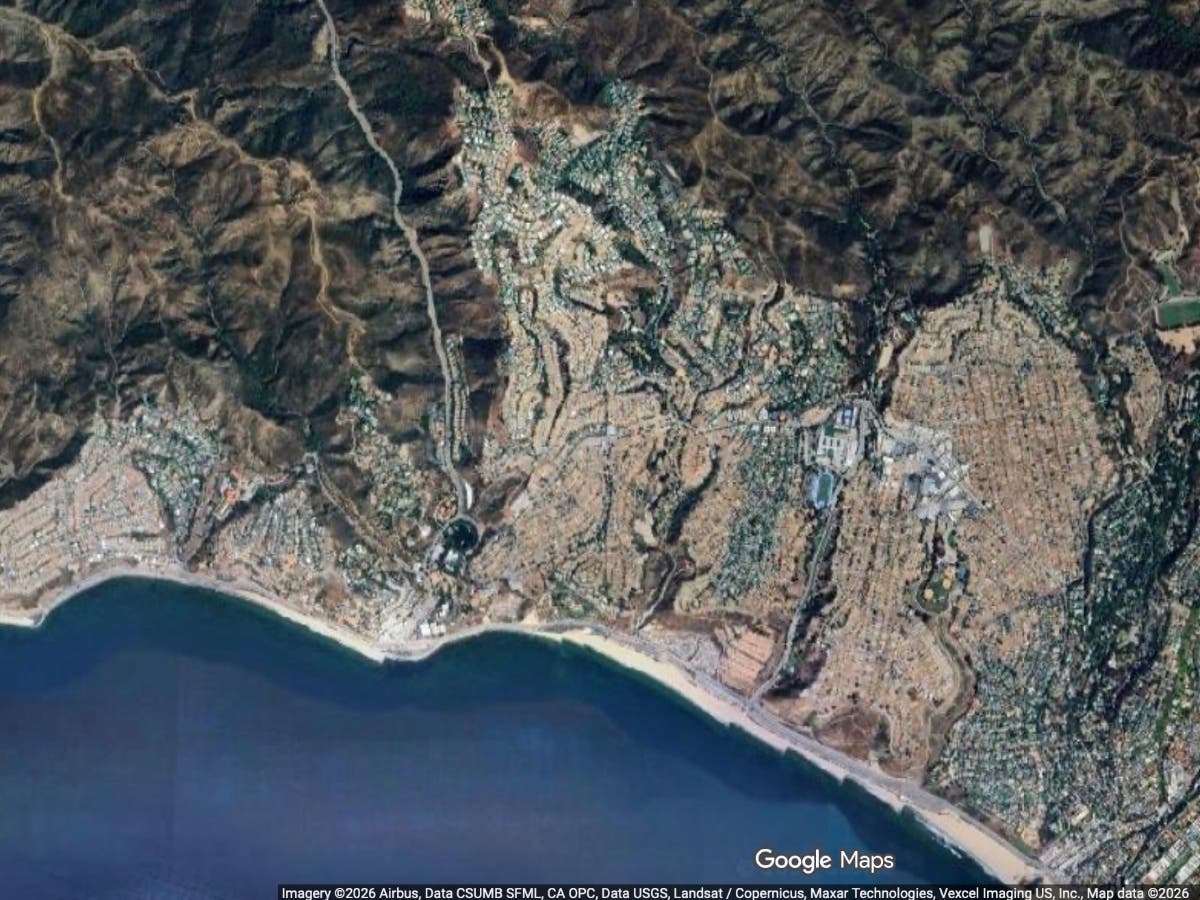
PACIFIC PALISADES, CA — A new report found that Pacific Palisades had the highest level of overall wellbeing of any place in Los Angeles County — though the data was based on data from before the devastating Palisades Fire.
The rankings were determined by a study published this month by Measure of America that was funded in part by the county. The study, "A Portrait of Los Angeles County 2026," is a follow-up to a 2017 edition that has guided the decision-making of county departments and nonprofits.
"Through this report, we hope to build upon our roadmap and better understand the successes that have allowed us to expand our culturally responsive, community-based services, but also learn where we need to do more work and close gaps in outcomes," said Dr. Lisa H. Wong, director of the county Department of Mental Health. "This report will guide us on how we design programs and allocate resources."
Find out what's happening in Pacific Palisadesfor free with the latest updates from Patch.
The study uses the American Human Development Index to rank overall wellbeing in the county's neighborhoods, cities and unincorporated areas, as well as by race and ethnicity and gender. The index combines data on life expectancy, earnings and education into a single score ranging from 0 to 10.
The neighborhood area consisting of Brentwood and Pacific Palisades had the highest HDI value of anywhere in the county at 9.58.
Find out what's happening in Pacific Palisadesfor free with the latest updates from Patch.
It also had the second-highest life expectancy at birth (88 years), the sixth-highest education index value (9.61) and sixth-highest median personal earnings ($103,500).
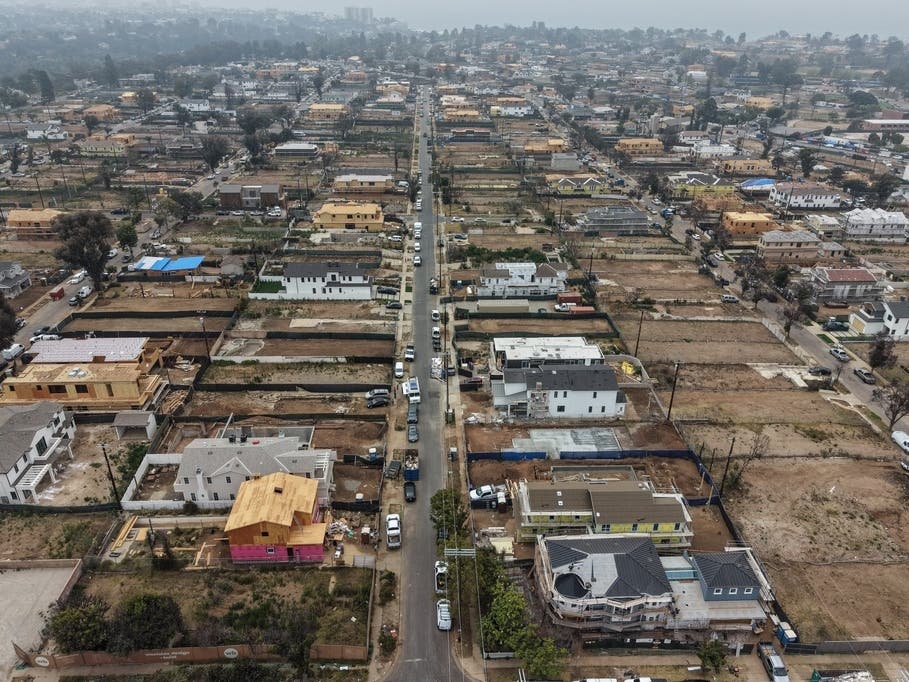
The study notes that the figures were calculated before the January 2025 Palisades Fire "The very people whose score was highest when calculated using 2023 data are now grappling with worlds of loss," the authors wrote.
For comparison, the county's lowest HDI value was in Southeast Los Angeles (3.03).
The Antelope Valley community of Sun Village had the lowest life expectancy at birth: 71.8. Residents there had a life expectancy 16 years shorter than in Westwood, which had the county's highest life expectancy (88.1).
The education index — calculated based on school enrollment and degree attainment — was highest in Westwood (9.91) and was lowest in the southeast LA County city of Maywood (1.67).
Median earnings were highest in Palos Verdes Estates ($120,200) and lowest in Westwood, home to a large population of UCLA students ($19,800). The city of Cudahy had the second-lowest median earnings ($28,300).
LA County Communities Ranked By HDI
| Community | HDI Score | Life Expectancy | Median Earnings | Edu. Index | |
|---|---|---|---|---|---|
| 1 | Brentwood Pacific Palisades | 9.58 | 88.0 | 103,500 | 9.61 |
| 2 | Palos Verdes Estates | 9.49 | 87.0 | 120,200 | 9.72 |
| 3 | Bel Air Beverly Crest | 9.20 | 86.1 | 98,000 | 9.20 |
| 4 | Manhattan Beach | 9.16 | 85.4 | 114,200 | 9.40 |
| 5 | Beverly Hills | 9.09 | 87.7 | 71,700 | 9.49 |
| 6 | Rolling Hills Estates | 9.07 | 85.9 | 78,800 | 9.58 |
| 7 | Malibu | 9.04 | 84.6 | 83,400 | 9.63 |
| 8 | La Cañada Flintridge | 9.00 | 83.4 | 110,200 | 9.75 |
| 9 | Calabasas | 8.98 | 85.1 | 89,800 | 8.98 |
| 10 | Rancho Palos Verdes | 8.98 | 84.3 | 95,000 | 9.32 |
| 11 | Agoura Hills | 8.93 | 84.7 | 89,400 | 9.01 |
| 12 | Westlake Village | 8.91 | 85.1 | 83,200 | 9.00 |
| 13 | Westchester Playa del Rey | 8.88 | 85.5 | 80,300 | 9.03 |
| 14 | San Marino | 8.82 | 85.6 | 74,400 | 9.31 |
| 15 | Sierra Madre | 8.82 | 82.7 | 83,200 | 9.76 |
| 16 | Hermosa Beach | 8.77 | 82.9 | 104,400 | 9.26 |
| 17 | Culver City | 8.71 | 83.5 | 87,600 | 8.83 |
| 18 | South Pasadena | 8.66 | 83.2 | 79,600 | 9.37 |
| 19 | Stevenson Ranch | 8.65 | 85.8 | 80,800 | 8.18 |
| 20 | Topanga | 8.62 | 85.7 | 70,300 | 9.08 |
| 21 | Santa Monica | 8.59 | 84.4 | 82,500 | 8.39 |
| 22 | Redondo Beach | 8.58 | 83.2 | 88,700 | 8.58 |
| 23 | Venice | 8.55 | 84.9 | 85,600 | 7.82 |
| 24 | West Los Angeles | 8.44 | 86.4 | 74,300 | 7.87 |
| 25 | El Segundo | 8.27 | 82.5 | 83,400 | 8.16 |
| 26 | Sherman Oaks Studio City Toluca Lake Cahuenga Pass | 8.17 | 84.4 | 71,400 | 8.17 |
| 27 | La Crescenta Montrose | 7.95 | 84.1 | 66,100 | 8.17 |
| 28 | Encino Tarzana | 7.93 | 84.3 | 62,700 | 8.40 |
| 29 | Arcadia | 7.88 | 85.4 | 60,700 | 7.99 |
| 30 | Palms Mar Vista Del Rey | 7.72 | 84.1 | 66,600 | 7.40 |
| 31 | Cerritos | 7.65 | 83.7 | 63,100 | 7.77 |
| 32 | Altadena | 7.54 | 82.9 | 62,600 | 7.78 |
| 33 | Torrance | 7.49 | 82.7 | 62,800 | 7.72 |
| 34 | Diamond Bar | 7.45 | 84.8 | 55,200 | 7.61 |
| 35 | Claremont | 7.35 | 82.3 | 49,800 | 9.07 |
| 36 | Pasadena | 7.31 | 82.9 | 59,600 | 7.46 |
| 37 | View Park Windsor Hills | 7.28 | 81.6 | 65,000 | 7.32 |
| 38 | Walnut | 7.26 | 83.6 | 54,600 | 7.63 |
| 39 | Marina del Rey | 7.21 | 77.9 | 105,400 | 6.67 |
| 40 | Del Aire | 7.00 | 83.6 | 66,500 | 5.47 |
| 41 | West Hollywood | 6.97 | 81.9 | 69,500 | 5.78 |
| 42 | Signal Hill | 6.78 | 82.0 | 61,200 | 6.04 |
| 43 | Chatsworth Porter Ranch | 6.77 | 82.6 | 54,800 | 6.55 |
| 44 | Burbank | 6.76 | 82.0 | 57,600 | 6.43 |
| 45 | La Verne | 6.75 | 80.9 | 56,200 | 7.00 |
| 46 | Castaic | 6.74 | 80.3 | 65,300 | 6.18 |
| 47 | Granada Hills Knollwood | 6.67 | 82.8 | 55,300 | 6.08 |
| 48 | Silver Lake Echo Park Elysian Valley | 6.66 | 83.9 | 51,400 | 6.12 |
| 49 | Santa Clarita | 6.65 | 82.0 | 57,500 | 6.09 |
| 50 | East San Gabriel | 6.56 | 84.7 | 44,700 | 6.46 |
| 51 | East Whittier | 6.48 | 79.4 | 59,300 | 6.46 |
| 52 | Glendale | 6.48 | 82.0 | 50,000 | 6.56 |
| 53 | La Mirada | 6.44 | 81.7 | 51,300 | 6.37 |
| 54 | Temple City | 6.40 | 82.0 | 48,800 | 6.46 |
| 55 | Canoga Park Winnetka Woodland Hills West Hills | 6.39 | 82.9 | 48,700 | 6.11 |
| 56 | Westwood | 6.37 | 88.1 | 19,800 | 9.91 |
| 57 | Alhambra | 6.35 | 83.4 | 47,800 | 5.91 |
| 58 | Monrovia | 6.35 | 80.8 | 51,200 | 6.54 |
| 59 | Hacienda Heights | 6.30 | 83.7 | 47,200 | 5.71 |
| 60 | San Dimas | 6.24 | 79.5 | 51,700 | 6.66 |
| 61 | Hollywood | 6.18 | 81.5 | 50,400 | 5.82 |
| 62 | Glendora | 6.17 | 79.0 | 52,200 | 6.59 |
| 63 | Wilshire | 6.11 | 83.3 | 44,800 | 5.67 |
| 64 | Monterey Park | 6.05 | 84.1 | 43,600 | 5.31 |
| 65 | Rowland Heights | 6.05 | 83.5 | 42,300 | 5.81 |
| 66 | Lakewood | 6.03 | 80.3 | 55,200 | 5.26 |
| 67 | San Gabriel | 5.99 | 84.0 | 42,900 | 5.33 |
| 68 | Northridge | 5.97 | 81.8 | 41,100 | 6.46 |
| 69 | Northeast Los Angeles | 5.90 | 83.2 | 43,500 | 5.29 |
| 70 | West Carson | 5.89 | 79.9 | 48,000 | 5.95 |
| 71 | Downtown | 5.83 | 79.8 | 59,700 | 4.28 |
| 72 | West Covina | 5.83 | 82.4 | 45,200 | 5.14 |
| - | California | 5.82 | 80.0 | 44,657 | 5.66 |
| 73 | San Pedro | 5.80 | 81.4 | 46,400 | 5.28 |
| 74 | Whittier | 5.76 | 80.4 | 47,400 | 5.44 |
| 75 | Duarte | 5.75 | 82.0 | 45,700 | 4.98 |
| 76 | Sunland Tujunga Lake View Terrace Shadow Hills East La Tuna Canyon | 5.73 | 81.6 | 46,000 | 5.03 |
| 77 | Lomita | 5.69 | 78.1 | 48,800 | 5.98 |
| - | LA County | 5.64 | 80.5 | 48,158 | 5.46 |
| 78 | North Hollywood Valley Village | 5.49 | 81.3 | 42,800 | 4.95 |
| City of Los Angeles | 5.48 | 81.0 | 41,800 | 5.21 | |
| 79 | Los Angeles | 5.48 | 81.0 | 41,800 | 5.21 |
| 80 | Quartz Hill | 5.48 | 79.1 | 54,900 | 4.11 |
| 81 | Long Beach | 5.40 | 79.2 | 44,700 | 5.24 |
| 82 | Downey | 5.39 | 81.0 | 43,400 | 4.72 |
| 83 | Carson | 5.36 | 79.5 | 45,700 | 4.89 |
| 84 | Reseda West Van Nuys | 5.29 | 80.5 | 40,900 | 5.02 |
| 85 | Covina | 5.28 | 79.4 | 45,100 | 4.76 |
| 86 | West Whittier Los Nietos | 5.21 | 80.0 | 45,800 | 4.17 |
| 87 | Van Nuys North Sherman Oaks | 5.20 | 80.7 | 40,500 | 4.74 |
| 88 | Charter Oak | 5.18 | 79.0 | 42,400 | 5.03 |
| 89 | Avocado Heights | 5.08 | 80.1 | 40,200 | 4.67 |
| 90 | Sylmar | 5.06 | 82.0 | 40,300 | 3.78 |
| 91 | Santa Fe Springs | 4.99 | 80.9 | 42,400 | 3.66 |
| 92 | Gardena | 4.95 | 78.9 | 39,800 | 4.83 |
| 93 | Montebello | 4.94 | 81.6 | 37,900 | 4.01 |
| 94 | South Whittier | 4.94 | 79.3 | 43,800 | 3.97 |
| 95 | Norwalk | 4.89 | 79.5 | 42,100 | 4.03 |
| 96 | Harbor Gateway | 4.84 | 80.9 | 38,200 | 3.98 |
| 97 | West Adams Baldwin Hills Leimert | 4.79 | 78.6 | 40,700 | 4.31 |
| 98 | Hawaiian Gardens | 4.76 | 83.7 | 36,500 | 2.85 |
| 99 | Pico Rivera | 4.76 | 80.0 | 41,500 | 3.51 |
| 100 | Rosemead | 4.76 | 82.4 | 35,100 | 3.70 |
| 101 | Alondra Park | 4.71 | 81.0 | 40,400 | 3.15 |
| 102 | Azusa | 4.71 | 78.9 | 36,300 | 4.77 |
| 103 | Artesia | 4.70 | 76.9 | 37,400 | 5.34 |
| 104 | Hawthorne | 4.66 | 78.7 | 38,600 | 4.24 |
| 105 | Bellflower | 4.61 | 78.5 | 38,500 | 4.22 |
| 106 | Lancaster | 4.61 | 75.1 | 46,500 | 4.29 |
| 107 | West Puente Valley | 4.54 | 79.3 | 38,300 | 3.72 |
| 108 | Inglewood | 4.52 | 79.1 | 37,000 | 3.99 |
| 109 | San Fernando | 4.48 | 80.0 | 38,300 | 3.24 |
| 110 | Palmdale | 4.47 | 77.4 | 40,500 | 3.90 |
| 111 | Mission Hills Panorama City North Hills | 4.38 | 80.4 | 34,300 | 3.56 |
| 112 | Lawndale | 4.38 | 78.6 | 37,100 | 3.72 |
| 113 | Commerce | 4.37 | 79.2 | 38,600 | 3.18 |
| 114 | Pomona | 4.34 | 79.2 | 35,300 | 3.70 |
| 115 | Wilmington Harbor City | 4.32 | 80.3 | 34,300 | 3.41 |
| 116 | Walnut Park | 4.30 | 80.8 | 35,300 | 2.93 |
| 117 | Sun Valley La Tuna Canyon | 4.27 | 79.2 | 35,000 | 3.53 |
| 118 | Citrus | 4.23 | 78.0 | 36,900 | 3.59 |
| 119 | Arleta Pacoima | 4.16 | 81.5 | 34,400 | 2.39 |
| 120 | Baldwin Park | 4.16 | 79.9 | 34,800 | 2.96 |
| 121 | El Monte | 4.11 | 80.9 | 32,200 | 2.94 |
| 122 | La Puente | 4.11 | 79.3 | 36,200 | 2.84 |
| 123 | South Gate | 4.08 | 80.0 | 34,500 | 2.75 |
| 124 | Bell | 4.05 | 81.7 | 32,100 | 2.45 |
| 125 | Valinda | 4.05 | 78.0 | 35,600 | 3.30 |
| 126 | South El Monte | 4.00 | 81.6 | 32,700 | 2.23 |
| 127 | Vincent | 3.97 | 76.3 | 37,600 | 3.38 |
| 128 | Paramount | 3.94 | 78.0 | 35,000 | 3.06 |
| 129 | Westlake | 3.89 | 79.6 | 31,800 | 2.93 |
| 130 | South Los Angeles | 3.82 | 78.2 | 31,800 | 3.33 |
| 131 | Boyle Heights | 3.80 | 80.6 | 30,600 | 2.52 |
| 132 | Huntington Park | 3.77 | 81.6 | 31,000 | 1.91 |
| 133 | Lake Los Angeles | 3.76 | 72.3 | 41,200 | 3.79 |
| 134 | West Athens | 3.72 | 74.7 | 35,000 | 3.80 |
| 135 | West Rancho Dominguez | 3.72 | 73.1 | 40,400 | 3.49 |
| 136 | East Los Angeles | 3.63 | 78.5 | 32,700 | 2.43 |
| 137 | South San Jose Hills | 3.62 | 77.4 | 33,200 | 2.72 |
| 138 | Lynwood | 3.55 | 77.6 | 32,800 | 2.51 |
| 139 | Maywood | 3.52 | 80.5 | 30,700 | 1.67 |
| 140 | Bell Gardens | 3.51 | 78.8 | 30,200 | 2.46 |
| 141 | Lennox | 3.51 | 78.8 | 31,500 | 2.20 |
| 142 | East Rancho Dominguez | 3.46* | 77.5 | 35,100 | 1.82* |
| 143 | Sun Village | 3.44 | 71.8 | 43,800 | 2.58 |
| 144 | Compton | 3.42 | 76.2 | 35,000 | 2.30 |
| 145 | Westmont | 3.32 | 74.4 | 32,600 | 3.22 |
| 146 | Willowbrook | 3.26 | 74.1 | 34,400 | 2.78 |
| 147 | Cudahy | 3.18 | 78.8 | 28,300 | 1.94 |
| 148 | Florence-Graham | 3.08 | 77.2 | 30,200 | 1.85 |
| 149 | Southeast Los Angeles | 3.03 | 77.7 | 29,000 | 1.78 |
* indicates estimates with a higher degree of uncertainty, researchers said.
The full study is available on Measure of America's website.
Get more local news delivered straight to your inbox. Sign up for free Patch newsletters and alerts.