Schools
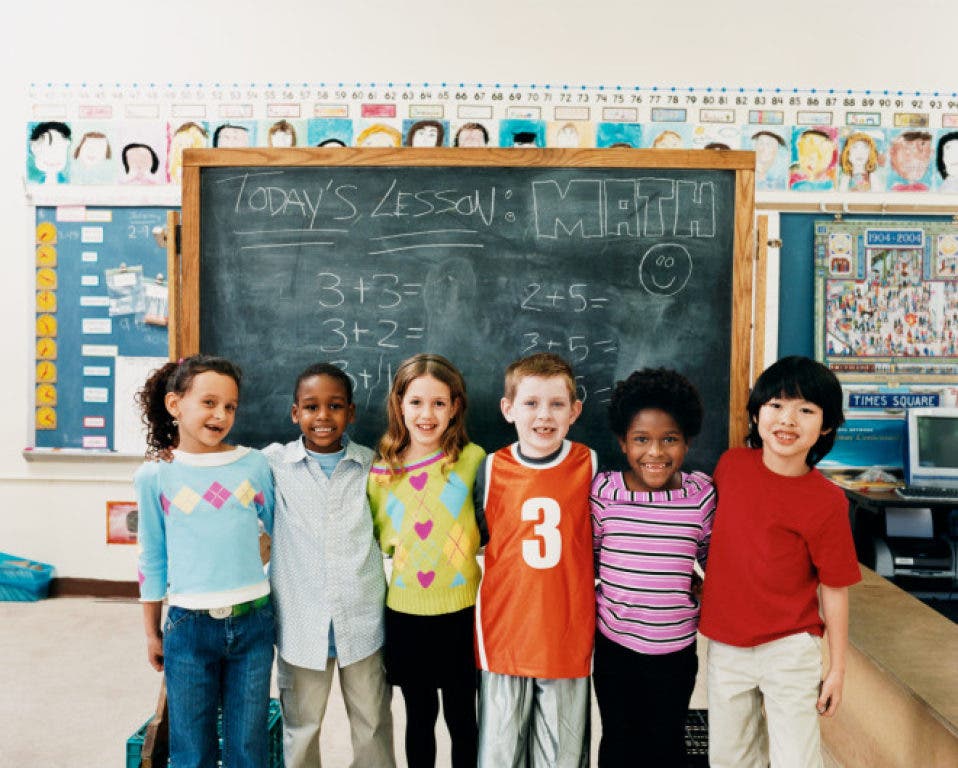
How Has Poway Unified Diversity Changed Over the Years?
A look at the different races and cultures represented in Poway Unified School District over the past decade.

One of the most repeated portions of Dr. Martin Luther King Jr.'s famous "I Have a Dream" speech from 1963 is the portion where he talks about his hope for children.
I have a dream that my four little children will one day live in a nation where they will not be judged by the color of their skin but by the content of their character.
I have a dream today!
Find out what's happening in Rancho Bernardo-4s Ranchfor free with the latest updates from Patch.
I have a dream that one day, down in Alabama, with its vicious racists, with its governor having his lips dripping with the words of "interposition" and "nullification"—one day right there in Alabama little black boys and black girls will be able to join hands with little white boys and white girls as sisters and brothers.
As the nation celebrates King on the federal holiday in his honor, Patch is taking a look at diversity among our community's children. According to the 2010-11 California Healthy Kids Survey, 15 percent of the Poway Unified School District's seventh- and ninth-graders, and 13 percent of 11th-graders reported being harassed because of their race, ethnicity or national origin at least once over the prior year. Twenty-two percent of ninth- and 11th-graders said there was a lot of tension between different cultures, races or ethnicities, according to the survey. However, the vast majority of those students (70 percent of ninth-graders; 69 percent of 11th-graders) said they hadn't experienced mistreatment or disrespect from adults at the school because of their race, ethnicity or nationality.
Find out what's happening in Rancho Bernardo-4s Ranchfor free with the latest updates from Patch.
See how the racial background of the Poway Unified School District's campuses has changed over the past decade, according to data from the California Department of Education.
Race/Ethnicity* 2002 2003 2004 2005 2006 2007 2008 2009 2010 African American/Black 3.3% 3.3% 3.2% 3.1% 3% 3.1% 3% 2.9% 3% American Indian or Alaska Native .5% .5% .5% .5% .4% .4% .4% .4% .4% Asian 11.9% 12.9% 13.8% 14.7% 15.4% 15.8% 16.5% 16.9% 18.1% Fillipino 6.6% 6.7% 6.8% 6.7% 7% 7.2% 7.4% 6.6% 6.9% Hispanic or Latino 9.4% 9.5% 9.6% 10% 10.4% 10.7% 11% 11.3% 12.3% Pacific Islander .5% .6% .6% .6% .6% .7% .7% .6% .5% White (not Hispanic) 65.3% 63.6% 61.7% 59.9% 58.1% 56.7% 55.3% 54.3% 56% Multiple or No Response 2.5% 3% 3.8% 4.4% 5% 5.3% 5.6% -- -- Two or More Races, not Hispanic (Added in 2009) 2.2% 2.9% No Response (Added in 2009) 4.8% .05%*In 2009, the caveat "not Hispanic" was added to all of the race categories except for white, which already included that restriction. The "Multiple/No Response" category also was broken down that year into two different sections for "Two or more races, not Hispanic" and "No Response."
Get more local news delivered straight to your inbox. Sign up for free Patch newsletters and alerts.