Business & Tech
Painting a Picture of the State Legislature
Local company helps residents make sense of state government through specialized graphics.

If you have trouble picturing exactly what goes on in state government, you're not alone. Thankfully there's someone working on that for you.
Enter Readily Apparent, a Georgetown-based company that specializes in data design and visualization. Co-owners Brendan Hanrahan and David Smith focus on taking complex data sets and rendering them more quickly and easily intelligible by, essentially, making them into pictures.
"The overall goal of the picture is to show how much work happens in six months," Hanrahan said of one of the graphics available on readilyapparent.com that covered the last six months of bills and activity in the Connecticut legislature. "We're trying to show quickly how the legislature works and allow people to navigate to policy areas that interest them most and see what the ultimate outcomes are."
Find out what's happening in Weston-Redding-Eastonfor free with the latest updates from Patch.
The company's visualizations are aimed at empowering residents and helping them understand exactly who and what their elected officials are doing.
"Today vast amounts of information are generated by people, government, businesses," Hanrahan said. "Our visualizations are designed to help make sense of it all...and to allow people to participate in government."
Find out what's happening in Weston-Redding-Eastonfor free with the latest updates from Patch.
Harnrahan pointed out that in the first half of 2011, 187 legislators discussed over 3,000 bills. Those decisions, he said, will go on to affect 3.5 million people in Connecticut.
"Very quickly, that adds up to information overload," he said.
So Hanrahan and Smith map those decisions, and also sort the data so that users can search for topics specific to their interests. The result is a simplified, birds-eye view of the legislature's activity.
While empowering the public, Hanrahan and Smith turn a profit by selling their methods to various lobbying and special interest groups and town committees. The public service they're providing doesn't hurt publicity, either, and they've received an excellent response from it.
"Since we published , [the response has been] overwhelming," Hanrahan said. "We looked at the analytics for [our last graphic] and the numbers of hits that we got was by far the largest we've ever seen in a two-week period...and from all kinds of sources- large businesses, advocacy groups, the government. Many, many visits from the government."
It seems even the legislators working on the bills need help visualizing the full breadth of their work at times.
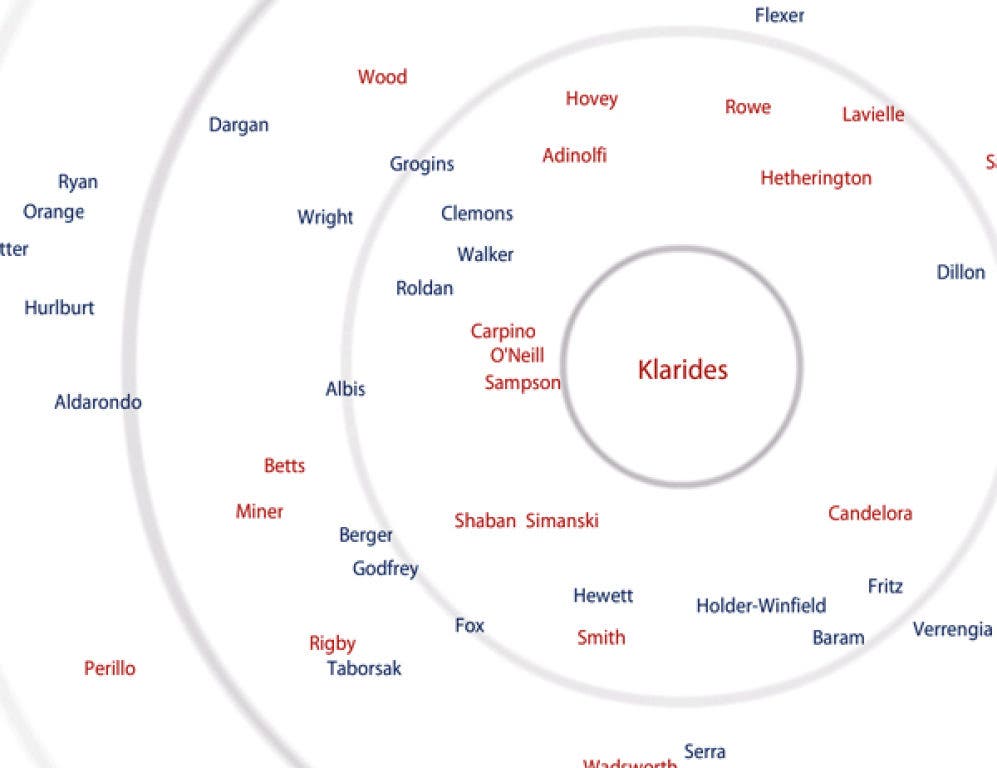
Readily Apparent's latest graphic, which headlines the site at present, is a fascinating representation of local politicians' voting records. The concentric circles and their intersections represent similarities and differences in political ideology and voting history between elected officials.
Hanrahan hopes to eventually offer a "ranking system based on a user's interests," where users could sort politicians according to their own preferences.
"It's exciting times for us, with lots of innovation ahead," Hanrahan said. "And that's really the part that we enjoy the most. The legislature is a data-rich environment so it provides a good opportunity to develop our skills and test our own ideas about what is helpful and not."
Get more local news delivered straight to your inbox. Sign up for free Patch newsletters and alerts.