Politics & Government
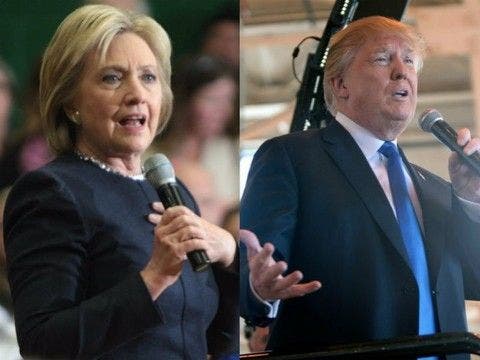
Hillary Voters Like Honda Civics; Trumpsters Prefer F-150s
Survey says Trump loyalists favor good, old-fashioned American horsepower. Clinton voters are more likely to buy Japanese and hybrids.

American voters, take notice. You might be able to tell who's winning your precinct this fall by surveying the cars in your polling place's parking lot.
A new poll conducted by the market intelligence firm Autolist.com, shows the difference in buying preferences among vehicle owners voting for one candidate versus the other is as different as the candidates themselves.
The poll found Hillary Clinton has a 40 percent to 38 percent lead over Donald Trump nationwide among current vehicle owners.
Find out what's happening in Atlantafor free with the latest updates from Patch.
It also surveyed the buying preferences of the prospective voters and compared the results among voter groups. According to the survey, the most common vehicle among Clinton voters is the Honda Civic, whereas for Trump supporters it is the Ford F-150.
Also, the most popular vehicle nationality of Clinton voters is Japanese at 46 percent; alternatively, the most popular nationality for Trump voters is American at 55 percent.
Find out what's happening in Atlantafor free with the latest updates from Patch.
The survey also showed a difference in likelihood to consider different factors when purchasing a vehicle. For instance, the survey states that Clinton voters are 30 percent more likely to buy a hybrid; 26 percent more likely to buy an electric vehicle; and 13 percent more likely to take vehicle gas mileage into consideration when buying a car than Trump voters.
By contrast, Trump voters are 17 percent more likely to care about engine horsepower and torque and 5 percent more likely to care about cargo capacity when buying a car than Clinton voters.
In addition to the data on Clinton and Trump, the results showed 14% of vehicle owners expect to vote for Gary Johnson in November, and 8% remain undecided.
The poll surveyed 2,566 vehicle owners nationwide with a margin of error of +/- 2 percent.
As the survey shows, the November presidential race is yet to be decided among the vehicle owner population, but the buying preferences of the committed voters of the two different candidates are as different as the candidates themselves.
You can see the full survey here.
Image Gage Skidamore Creative Commons
Get more local news delivered straight to your inbox. Sign up for free Patch newsletters and alerts.