Politics & Government
Dacula’s Hispanic Population Triples
City adds almost 600 residents overall since last census.

The City of Dacula experienced a 15 percent increase in population between 2000 and 2010 according to the latest data released by the United States Census Bureau.
said he believes the numbers could have been higher.
“Of course we would have had a bigger growth had the economic situation not hit us,” he said.
Find out what's happening in Daculafor free with the latest updates from Patch.
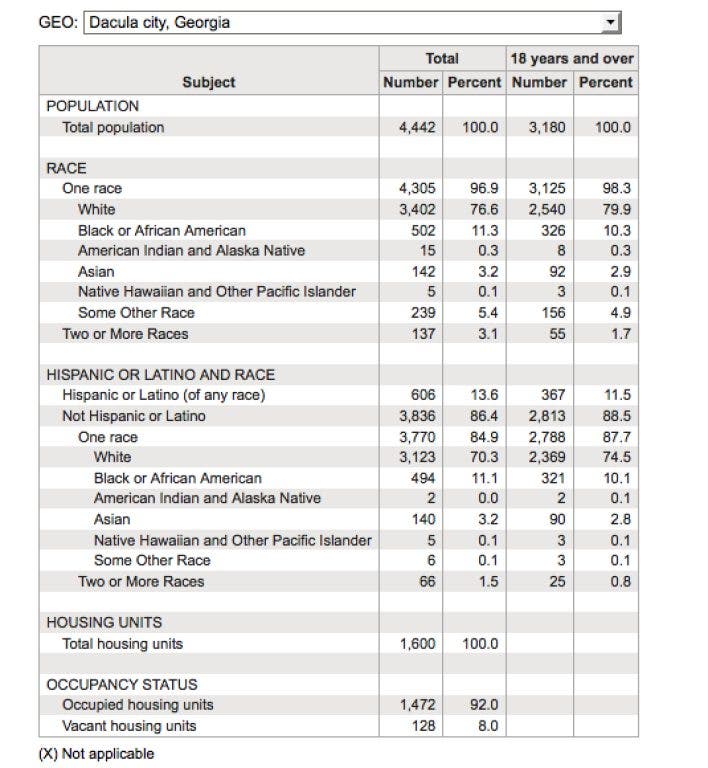
In the most recent count, the city had 4,442 residents compared with 3,848 in 2000. Of those residents, 3,402 or 76.6 percent are white, 502 are listed as black or African American (11.3 percent) and 142 are Asian (3.2 percent). Other races listed include American Indian and Alaska native (.3 percent), native Hawaiian and other Pacific Islander ( .1 percent), some other race (5.4 percent) and two or more races (3.1 percent).
Another 606 or nearly 14 percent of Dacula residents identified themselves as being Hispanic or Latino. For census purposes, race and Hispanic or Latino origin are treated as two separate concepts. According to guidelines from the Office of Management and Budget, people who are listed as Hispanic may be of any race and people in each race group may identify themselves as Hispanic or not Hispanic. For example, white Hispanics are included in the number of whites and in the number of Hispanics. This treatment results in overlapping data. For that reason, Hispanic population totals are listed separately from totals by race.
Find out what's happening in Daculafor free with the latest updates from Patch.
CHANGES SINCE 2000
The demographics of Dacula, like the rest of the state, have shifted considerably since the 2000 census. Mayor Wilbanks said the change was not unexpected.
“I think it’s in line with what’s happening in Gwinnett County,” Wilbanks said. “The county is becoming more diverse and it’s moving this way. I expected the diversity would change considerably.”
In the last census, 65.1 percent of the state’s population was white. In 2010, it was 59.7 percent. Gwinnett County’s white population fell from 65.1 percent in 2000 to 53.3 percent in 2010. In Dacula, 89 percent of the population was identified as white in 2000 compared with 76.6 percent in 2010.
Dacula’s black and African American population grew from 4 percent in 2000 to 11.3 percent in 2010. For Gwinnett County as a whole, the black and African American fell, dropping from 28.7 percent in 2000 to 23.6 percent in 2010. Statewide, the percentage of blacks and African Americans increased from 28.7 percent in 2000 to 30.5 percent in 2010.
The most dramatic shift over the past decade was in the number of people identifying themselves as Hispanics. In Dacula, 3.7 percent of the population was identified as Hispanic or Latino in 2000. The most recent numbers show the percentage of Dacula’s Hispanic and Latino population more than tripled to 13.6 percent.
Wilbanks said he believes those numbers are lower than what he has seen in recent years.
“We had a lot more Hispanic folks that I could see at least out there in the neighborhoods and a lot of those have moved on following the work,” he said.
Statewide, the number of census respondents identifying themselves as Hispanic or Latino increased from 5.3 percent in 2000 to 8.8 percent in 2010. In Gwinnett, only 5.3 percent of respondents were reported as Hispanic or Latino in 2000 compared to 20.1 percent in 2010.
Though Wilbanks believes Dacula’s census numbers are fairly accurate, he does have some doubts since he did not receive a census form and had to request one after the deadline had passed.
“I don’t even know if I got counted or not,” he said.
Complete census results are available on the United States Census Bureau web site at www.census.gov.
Get more local news delivered straight to your inbox. Sign up for free Patch newsletters and alerts.