The hurricane season officially started on June 1st of this year, but so far we haven't really had that much to talk about... yet. All of that may be coming to an end very soon though.
There are several known patterns in the atmosphere, I've mentioned the ENSO (El Niño-Southern Oscillation), but one pattern that I haven't spent much time talking about is the MJO or Madden–Julian Oscillation. I could spend a lot of time with an explanation of how the MJO works, but one of the important aspects is the fact that it actually moves and is not static like the ENSO. If you are interested in what the MJO is and how it works, click this link for much more information about the MJO. I also have the MJO charts for all the major computer models here.
Meteorologist have been following the MJO with great interest this summer, as the MJO is a powerful predictor for tropical activity. It appears that a strong MJO is about to occur, and may be the initiator of an increased period for significant tropical weather.
Find out what's happening in Daculafor free with the latest updates from Patch.
One meteorologist that has a great interest in the MJO is Mike Ventrice PhD. Mike's PhD research was focused on convectively coupled atmospheric Kelvin waves and the Madden Julian Oscillation and their impact on global circulation patterns and Atlantic tropical cyclone activity, so he has an intimate knowledge of the MJO and it's effects on our sensible weather. Today Mike made a post on a weather forum I follow regarding the upcoming MJO phase and its amplitude, and how the MJO may predict the upcoming tropical period. Here's what Mike had to say...
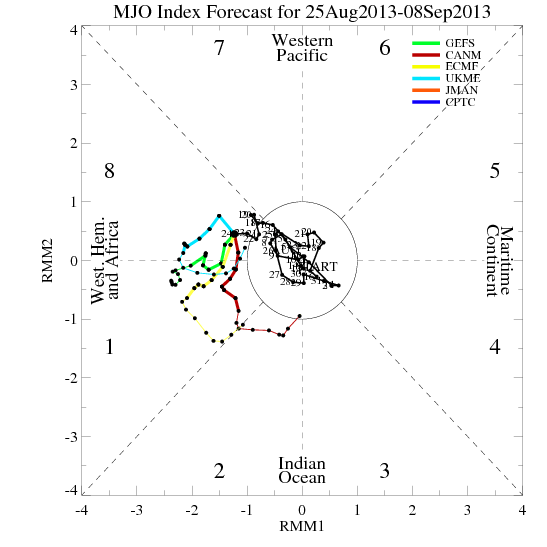
"Now with regards to the current evolving MJO event over the East Pacific, the GFS operational forecast for 8/29 in the VPM framework is for phase 8 at amplitude 1.85.
Find out what's happening in Daculafor free with the latest updates from Patch.
If verified, this would rank as the 3rd strongest MJO event over the Western Hemisphere in the month of August dating back to 1989. The strongest VPM phase 8 in August occurred in 2001 on 8/22. 2nd strongest occurred on 8/15/2012, then the current event on 8/29, followed by 8/22/2004, then 9/23/2002.
So top 5 in form of date (amplitude):
1. 8/22/2001 (2.34 sigma)
2. 8/15/2012 (2.33 sigma)
3. 8/29/2013 (1.85 sigma) *FORECAST*
4. 8/22/2004 (1.84 sigma)
5. 8/23/2002 (1.76 sigma)
For these years from the date where the VPM read the strongest value in August and ending in September, there were 31 named tropical cyclones, 21 of which formed over the MDR in the form of a “Cape Verde” disturbance. Furthermore, 21 out of the 31 (68%) tropical cyclones reached at least a category 1 hurricane in strength.
Named storms from the first date when the VPM indices read phase 8 to the end of following September, each year in rank of strongest VPM phase 8 in August.
A. 2001
1. TS DEAN 8/22
2. H-3 Erin 9/1
3. H-3 Felix 9/7
4. H-1 Gabrielle 9/11
5. TD9 9/19
6. H-2 Humberto 9/21
B. 2012
1. H-2 Gordon 8/15
2. H-1 Isaac 8/20
3. TS Joyce 8/31
4. H-2 Kirk 8/28
5. H-1 Leslie 8/28
6. H-3 Michael 9/2
7. H-1 Nadine 9/10
C. 2013
???
D. 2004
1. H-4 Francis 8/25
2. H-1 Gaston 8/27
3. TS- Hermine 8/27
4. H-5 Ivan 9/2
5. TD10 9/7
6. H-3 Jeanne 9/13
7. H-4 Karl 9/16
8. H-1 Lisa 9/19
E. 2002
1. TS Dolly 8/29
2. TS Edouard 9/1
3. TS Fay 9/5
4. TD 7 9/7
5. H-2 Gustav 9/8
6. TS Hanna 9/12
7. H-3 Isidore 9/14
8. ET Joseph 9/17 (*counted as a tropical cyclone in this analysis*)
9. H-1 Kyle 9/20
10. H-4 Lili 9/21
Best Regards,
Mike V."
So now let's sit back and see how this evolves.