Crime & Safety
Darien Cops Doing More Stops This Decade
This is while other towns have seen a decline in traffic stops.

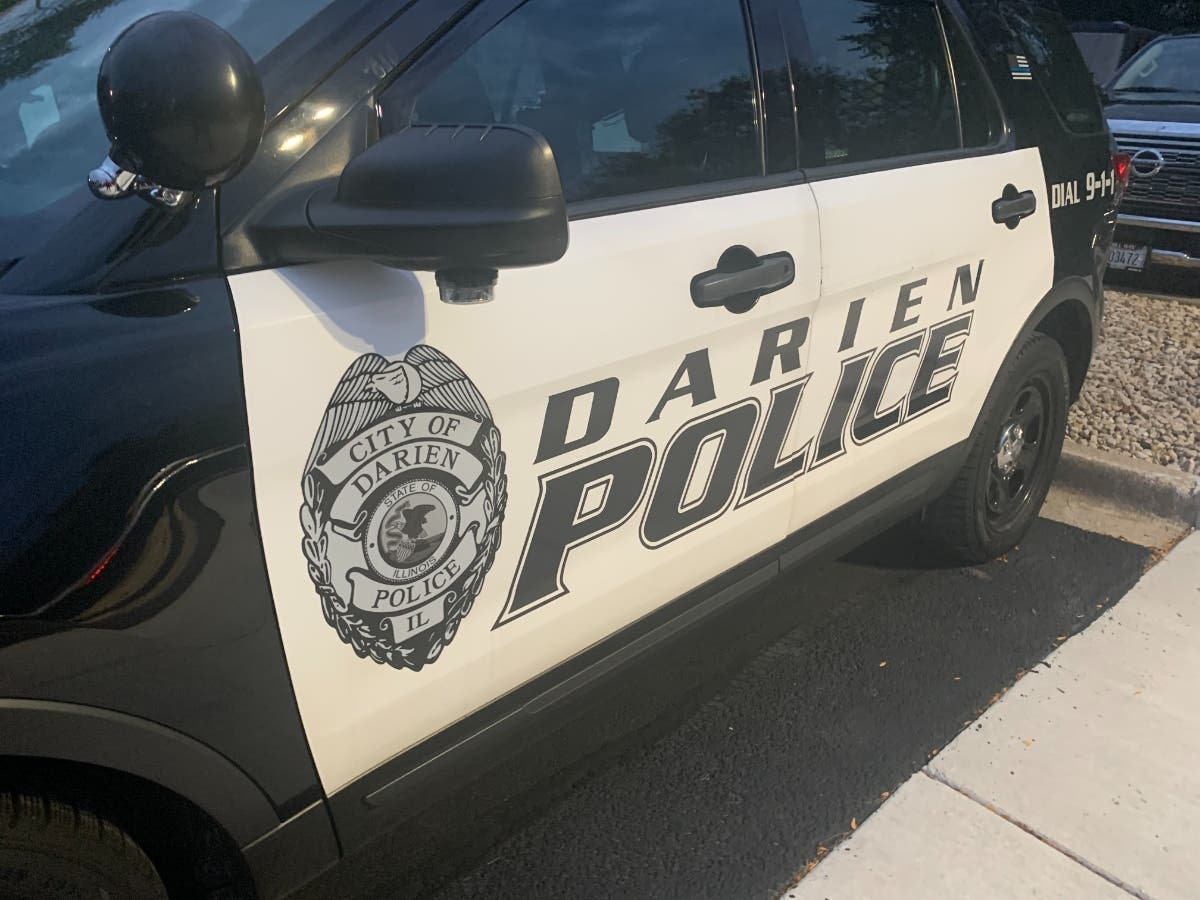
DARIEN, IL – Some police departments are making fewer traffic stops in the 2020s.
Not Darien, which is conducting more.
This week, Patch examined the traffic stop reports for the last couple of decades in Darien, as well as Elmhurst, La Grange, Hinsdale, Burr Ridge, Western Springs and Clarendon Hills. The state mandates annual reports.
Find out what's happening in Darienfor free with the latest updates from Patch.
The latest data is from 2024. In that year, Darien police conducted 4,401 traffic stops, which works out to a dozen a day.
From 2021 to 2023, the police were logging 5,300 to 6,700 stops a year. Those numbers are higher than much of the previous decade.
Find out what's happening in Darienfor free with the latest updates from Patch.
Since 2004, though, Darien officers have been less likely to give tickets during traffic stops.
In 2024, local officers issued citations in 26 percent of stops, compared with Elmhurst at 56 percent, Hinsdale at 34 percent, Burr Ridge at 33 percent, Clarendon Hills at 31 percent and Western Springs at 27 percent. La Grange was lower at 21 percent.
In 2015, Illinois enacted a law banning police departments from enforcing citation and arrest quotas, although most agencies said they maintained no such practices.
Whether that law is the cause or not, ticket rates dropped in Darien and Hinsdale, among other towns, after that law took effect.
Check the number of traffic stops and the percentages that resulted in tickets:
Darien
2024: 4,401/26%
2023: 5,301/24%
2022: 5,374/27%
2021: 6,774/26%
2020: 4,944/28%
2019: 4,336/33%
2018: 3,994/38%
2017: 3,027/37%
2016: 2,806/41%
2015: 2,105/42%
2014: 2,819/52%
2013: 3,530/46%
2012: 3,418/32%
2011: 4,466/28%
2010: 4,391/35%
2009: 4,749/39%
2008: 3,893/42%
2007: 4,268/51%
2006: 4,562/50%
2005: 5,535/56%
2004: 5,598/62%
Elmhurst
2024: 10,934/56%
2023: 8,976/52%
2022: 8,038/52%
2021: 8,167/50%
2020: 7,040/53%
2019: 10,408/51%
2018: 12,140/48%
2017: 11,838/47%
2016: 10,628/43%
2015: 11,426/52%
2014: 10,563/51%
2013: 10,519/62%
2012: 6,741/89%
2011: 12,279/53%
2010: 16,036/53%
2009: 12,615/54%
2008: 8,408/56%
2007: 10,700/54%
2006: 12,127/56%
2005: 12,812/57%
2004: 12,556/45%
Hinsdale
2024: 4,563/34%
2023: 4,676/33%
2022: 4,869/37%
2021: 4,111/38%
2020: 3,645/45%
2019: 4,704/43%
2018: 4,356/40%
2017: 5,137/42%
2016: 5,381/44%
2015: 5,129/47%
2014: 4,289/51%
2013: 3,771/52%
2012: 4,560/51%
2011: 5,148/54%
2010: 4,725/50%
2009: 5,925/52%
2008: 4,860/57%
2007: 5,800/55%
2006: 5,967/49%
2005: 4,644/47%
2004: 5,514/48%
Clarendon Hills
2024: 2,515/31%
2023: 982/28%
2022: 997/27%
2021: 818/31%
2020: 598/39%
2019: 1,989/51%
2018: 1,993/49%
2017: 1,689/41%
2016: 2,080/39%
2015: 1,842/41%
2014: 2,073/41%
2013: 2,323/48%
2012: 1,463/52%
2011: 2,236/61%
2010: 2,113/66%
2009: 2,881/65%
2008: 2,020/65%
2007: 2,178/53%
2006: 2,250/53%
2005: 2,292/47%
2004: 2,845/45%
La Grange
2024: 2,925/21%
2023: 1,963/23%
2022: No report
2021: No report
2020: No report
2019: 2,340/18%
2018: 2,283/30%
2017: 2,970/34%
2016: 2,837/29%
2015: 2,910/32%
2014: 3,294/35%
2013: 3,346/46%
2012: 3,024/42%
2011: 6,061/35%
2010: 8,001/42%
2009: 6,788/41%
2008: 3,822/57%
2007: 3,117/62%
2006: 3,159/63%
2005: 2,493/69%
2004: 3,492/66%
Western Springs
2024: 1,694/27%
2023: 1,385/21%
2022: 2,214/6%
2021: 2,507/7%
2020: 1,390/13%
2019: 2,563/21%
2018: 2,731/22%
2017: 2,781/22%
2016: 1,623/28%
2015: 2,284/33%
2014: 2,651/45%
2013: 2,901/41%
2012: 2,704/44%
2011: 3,055/49%
2010: 2,369/40%
2009: 2,248/48%
2008: 3,035/59%
2007: 2,943/64%
2006: 2,904/67%
2005: 1,900/50%
2004: 2,293/46%
Burr Ridge
2024: 3,841/33%
2023: 3,498/39%
2022: 3,300/35%
2021: 2,411/33%
2020: 1,733/35%
2019: 3,958/32%
2018: 3,843/31%
2017: 4,248/29%
2016: 4,635/29%
2015: 4,820/34%
2014: 4,546/38%
2013: 4,341/35%
2012: 4,401/32%
2011: 4,853/28%
2010: 4,119/36%
2009: 5,788/34%
2008: 4,761/38%
2007: 3,508/39%
2006: 3,483/46%
2005: 3,457/46%
2004: 3,549/55%
Get more local news delivered straight to your inbox. Sign up for free Patch newsletters and alerts.