Neighbor News
How is the Naperville, IL real estate market doing?
Let's explore the various metrics that can help buyers and sellers make informed decisions in Naperville, IL

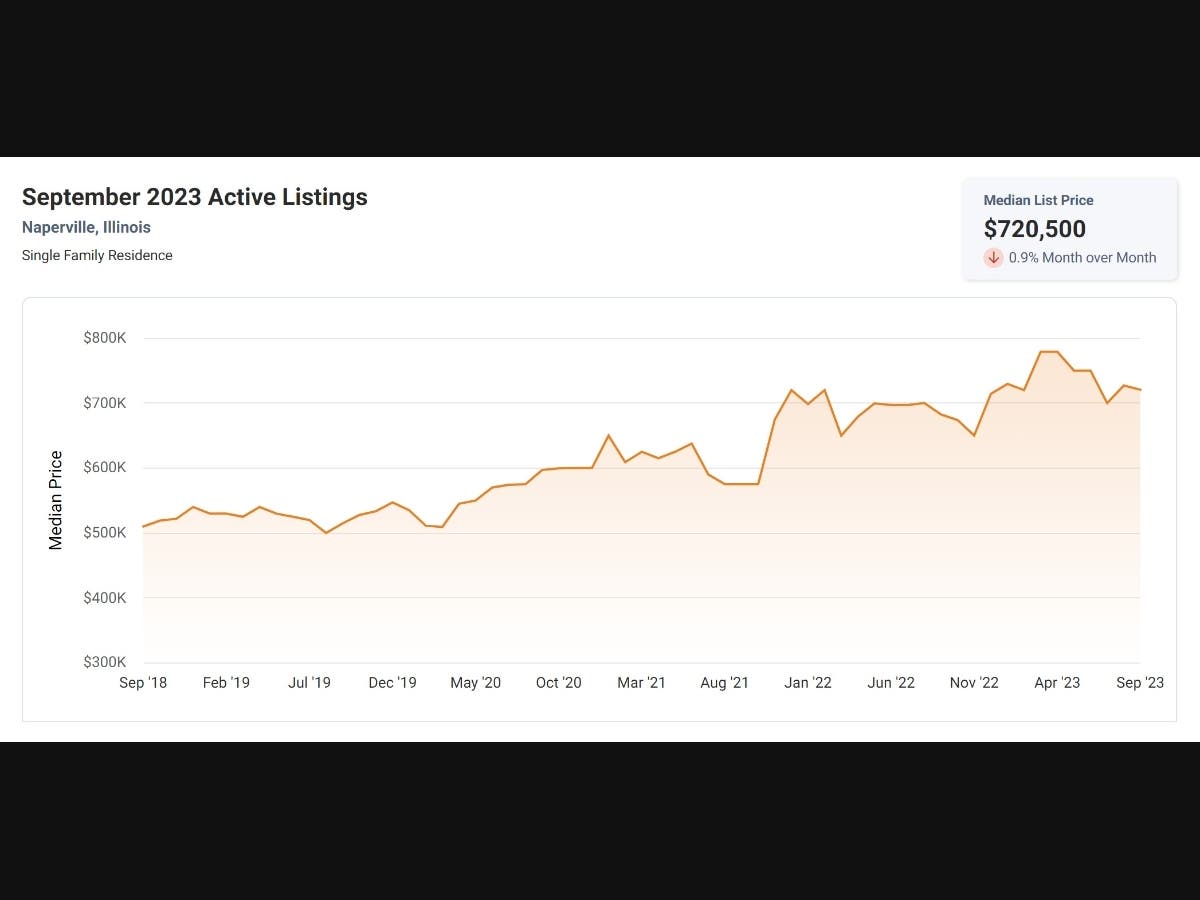
In the real estate market, there are several key metrics that can provide valuable insights for both buyers and sellers. Understanding these metrics can help individuals make informed decisions when it comes to selling or buying homes for sale in Naperville, IL. Let's dive into the correlation between the following real estate metrics:
First, let's look at the "Months Supply of Inventory," which currently stands at 1.51 for Naperville single-family homes. This metric represents the number of months it would take to sell all the available homes on the market, given the current sales pace. A lower value indicates a seller's market, where demand exceeds supply. In this case, the relatively low value of 1.51 suggests that there is limited inventory available, which could potentially drive up prices.
Next, we have the "12-Month Change in Months of Inventory," which shows a decline of -23.35%. This metric measures the percentage change in the months of inventory over the past year. The negative value indicates a significant decrease in the number of homes for sale in Naperville, IL compared to the previous year. This decline suggests a tightening market where properties are being sold at a faster pace.
Find out what's happening in Napervillefor free with the latest updates from Patch.
Moving on to the "Median Days Homes are On the Market," we find that homes are typically selling within 20 days in Naperville. This metric represents the average number of days it takes for a property to go from listing to being sold. A lower value indicates a faster-moving market with high demand. In this case, the relatively low value of 20 days suggests that properties are selling quickly, potentially due to a combination of limited inventory and high buyer demand.
Another important metric is the "List to Sold Price Percentage," which currently stands at 100.7%. This metric indicates the percentage at which the final sale price of a property compares to its initial listing price. A value above 100% suggests that properties are selling for more than their initial listing price, indicating a competitive market where buyers are willing to pay a premium.
Find out what's happening in Napervillefor free with the latest updates from Patch.
Finally, we have the "Median Sold Price," which is currently at $595,000 for single-family homes in Naperville. This metric represents the middle point of all the sold prices in a given area. It provides an indication of the overall pricing trend in the market. The median sold price of $595,000 suggests that properties in this market are selling at a relatively high price point.
When we consider the correlation between these metrics, it becomes evident that the real estate market being analyzed is experiencing a seller's market. The low months supply of inventory, coupled with a significant decline in inventory compared to the previous year, indicates a limited availability of properties. This scarcity, along with the relatively short time homes are spending on the market, suggests a high level of buyer demand. As a result, properties are selling for above their initial listing price, as indicated by the list to sold price percentage. The median sold price of $595,000 further supports the notion of a competitive market with higher price points.
For buyers, this analysis indicates that they may face challenges in finding available properties in Naperville and should be prepared for potential bidding wars. On the other hand, sellers can expect a favorable market where their properties may sell quickly and potentially at a higher price. Overall, understanding these real estate metrics can empower both buyers and sellers to make informed decisions in this dynamic market.