Neighbor News
Paying Off Triangle's $47 Million Debt to Orland Park
Start With Competent Financial Analysis

Mayor Keith Pekau recently claimed that Orland Park is owed $47 million by the Triangle TIF project. According to his math, it will take 342 years to pay this off, which he sarcastically notes is around the time of "Star Trek's" Jean-Luc Picard. But let’s dig into his numbers and see if this claim holds up.
Mayor Pekau’s Estimate
Here’s the breakdown Mayor Pekau used:
- A $750,000 annual land lease for 16 years, totaling $12 million.
- $6 million in property taxes from Ninety7Fifty on the Park over four years.
- After those four years, $81,000 annually in property taxes (about 5.4% of the total taxes).
What Else Should Have Been Included or Changed?
Pekau’s analysis missed one important cash inflow: Sales Taxes from the CVS Pharmacy: Located in the medical facility, the CVS generates sales taxes, estimated at $399,000 in 2024 (see appendix) and increasing by 5% annually. While incremental sales taxes don’t have to be included in TIF accounts, in this case they definitely are the direct result of TIF investments so they should be counted ( 65 ILCS 5/11-74.4-3(g)-(h)).
Find out what's happening in Orland Parkfor free with the latest updates from Patch.
There are even more funds available from utility tax increments (65 ILCS 5/11-74.4-3(j)-(k)) but we leave this for others to analyze.
Pekau incorrectly accounted for the University of Chicago Medical Center (UCMC) Lease: This lease provides annual payments for 25 years, which started in 2017 after the facility was occupied in November 2016. It still has 18 years left, with decreasing annual payments after 2032 (Ground Lease, Village of Orland Park, as Landlord and The University of Chicago Medical Center, as Tenant).
Find out what's happening in Orland Parkfor free with the latest updates from Patch.
We use Pekau’s estimate of $6 million in property taxes from Ninety7Fifty on the Park over the next four years, assuming $1.5 million annually.
We use Pekau’s estimate of $81,000 per year in property taxes for the first year (2024) but assume a 5% growth annually and don’t start including the money until year 5.
What Happens When We Include The Changes?
Let’s incorporate these additional sources of revenue. We use the ubiquitous financial method that incorporates time and interest rate, called Present Value (PV). Present Value tell us how much cash received in the future is worth today. This lets us see if the Triangle TIF debt can be repaid sooner, which will happen when the Present Value of the future cash flows equals $47 million.
Here are the cash inflows we use:
· TIF property taxes: $1.5 million annually for four years.
· UCMC lease payments: Starts at $770,000 in 2024, decreasing after 2032, for 18 years.
· CVS sales taxes: $399,000 in 2024, growing by 5% annually.
· Incremental property taxes: Starting at $81,000 and growing by 5% annually, but not counted for the first four years.
We use Orland Park’s mean bond interest rate of 3.3% to discount the future cash flows back to the present. For the mathematical details, please see the appendix.
The present value of the future cash flows is $47 million after only 47 years!
| Source | Present Value. |
| TIF property taxes | $5,535,878 |
| UCMC lease payments | $9,648,436 |
| CVS sales taxes | $27,077,638 |
| Property tax increment | $5,175,487 |
| TOTAL PRESENT VALUE | $47,437,439 |
So when all these cash flows are identified and dealt with correctly, the total present value equals the $47 million debt, indicating that it can be fully repaid with interest in 47 years—not the 342 years without interest as suggested earlier.
This analysis demonstrates the financial viability of the Triangle TIF, highlights how it aligns with long-term community and economic goals, and illustrates why financial analysis must be done by experts.
The Real Value of the Triangle TIF: Mayor McLaughlin’s Legacy Project
Focusing on finances misses the real value of TIFs.
“TIFs including projects like train stations, retention ponds, and university health centers do not generate enough direct tax and lease revenue to cover their costs. But, as in the case of Orland Park’s Triangle TIF, their wider economic and social benefits make them worthwhile investments.
For example, the retention pond prevents serious flooding and its consequences, and the University of Chicago Medical Facility offers area residents high quality care from one of the nation’s best medical schools. They all show how cities can use financing tools to create long-term value for the community, even when traditional business measurements suggest otherwise.
Success comes from looking beyond direct financial returns to consider how these projects improve community development, economic growth, sales tax increases and quality of life. These too have economic value, but it is indirect and difficult to measure.” (https://bit.ly/TIF-value)
Conclusion
Mayor Pekau’s estimates miss a key source of revenue and don’t account for growth, time and interest. When these are included, cash flows resulting from the TIF will repay the debt with interest in 47 years, not 342 years without interest.
More importantly, the Triangle TIF is already delivering its real goals by improving the community and strengthening Orland Park’s economy. Instead of being a failure, this project stands as a strong legacy to effective governance.
APPENDIX
Why Time and Interest Rates Matter in Debt Analysis
To accurately determine when the $47 million Triangle TIF debt will be repaid, it is essential to consider the time value of money and interest rates. Money received or spent in the future is not worth the same as money today due to borrowing costs. Ignoring time and interest will result in highly misleading conclusions.
Our approach uses Present Value (PV) calculations to accurately adjust future cash flows to their current worth. By applying a discount rate—based on Orland Park’s bond interest rate of 3.3%—our method reflects the reduced value of future payments and ensures an accurate comparison of these revenues against the debt owed today.
Using a procedure that accounts for time and interest rates is not optional—it is critical for sound financial analysis. Without it, we make decisions based on faulty assumptions, obscuring the true viability and benefits of community investments like the Triangle TIF.
Present Value Calculations
Money loses value over time because you could invest money now and get that money plus interest at a later date. Present Value (PV) lets you calculate how much a future amount of money is worth today (the present), considering how time and interest rates affect its value. For example, if you have a $100 today and invest it for a year at 5%, then at the end of the year you will have $105. So, the value today of $105 received in a year is $100, because the future value of $100 today at the end of a year is $105. The value today is its present value (PV) and the value of money today at some time in the future is its future value (FV).
Here's another example with the formula: If someone offers you $100 one year from now, how much is that worth today? If the interest rate is 5%, the PV is:
PV = Future Value/(1 + Interest Rate)^time
PV = $100/(1 + 0.05)^1 = $95.24
This means $100 in a year is worth about $95.24 today, assuming a 5% interest rate. In simple terms, PV answers: How much would I need to invest today to have that future amount later?
(The caret ^ represents exponentiation, e.g., 2^3 means 2 to the power of 3.
Now, what is the PV of $100, received after 5 years, worth today, assuming a 5% interest rate.
PV = $100/(1 + 0.05)^5 = $78.35
The formula gets a lot more complex if you’re getting cash at the end of each year for more than one year, but hopefully you understand why we have to reduce all future cash flows back to their value at present so we will know what they are worth to us today, compared to what we owe today. Before looking at the complex formulae, we show this manually in the attached two-part data table
What the Data Table Shows Us
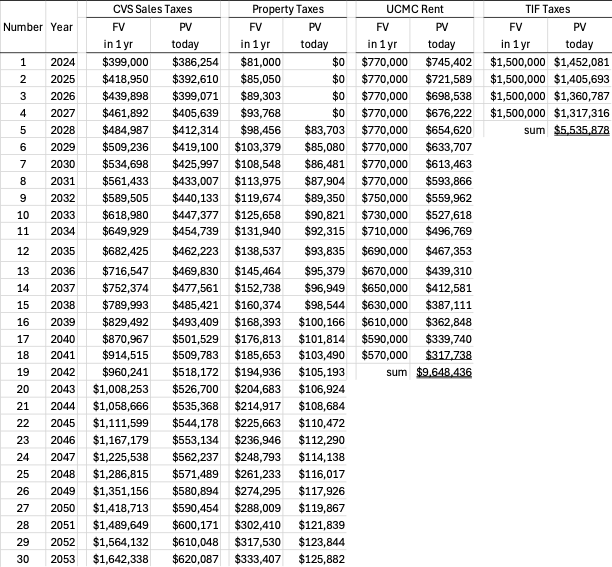
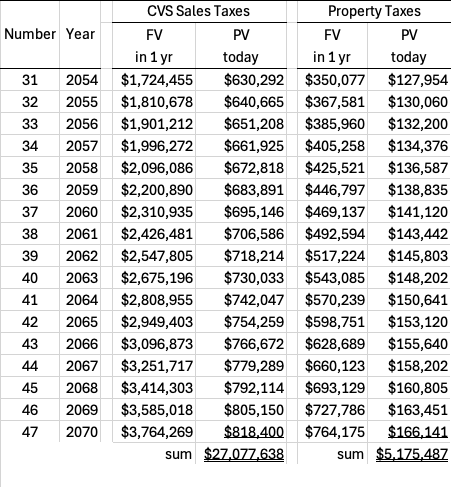
The data table illustrates how the future cash flows from the Triangle TIF project are converted into their present value, after accounting for growth. This allows us to assess when they will be sufficient to cover the $47 million debt. Each future stream of income—such as property taxes, lease payments, and sales taxes—is broken down by year and adjusted for growth and for the time value of money. This adjustment accounts for growth and the fact that money received in the future is worth less today, based on the discount rate of 3.3%.
For example:
The University of Chicago Medical Facility future lease payment in 2036 is $690,000. Because this payment will be received after 12 years, its present value is
PV = Future Value/(1 + Interest Rate)^time = $690,000/(1 + 0.033)^12 = $467,353
For another example, the incremental property taxes, beginning at $81,000 annually, grows at 5% annually. So in the 47th year its future value is
FV47 = $81,000*(1 + 0.033)^(47-1) = $764,175
The minus 1 in the exponent occurs because the initial value does not start growing until year 2, since we get the money at the end of year 1, so the exponent in year 2 would be (1+0.033)^1 = (1+0.033)^(2-1).
And the PV of $764,175 is
PV = $764,175/(1.03347)^47 = $166,141
Then, we sum the present values in each of the four income streams, and finally sum the PVs of the four streams to get the project's total present value.
Now, let’s turn to the mathematical formulae and calculations.
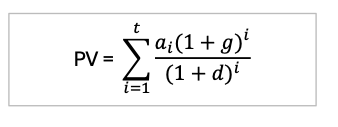
We’ll calculate the Present Value (PV) for each cash flow stream, using the following notation:
· “ai” is the first year value for varying cash flows, some years increasing and others decreasing
· “ao” is for a cash flow that is constant or that is increasing at the growth rate “g”
· “d” is the discount rate, herein set at 3.3%.
· “g” is the revenue growth rate, herein set at 5% when used
· “t” is the number of years we will receive a cash flow
Growing Cash Flows with the first one (ao) received at the end of year 1
This includes (1) TIF property taxes for the first four years (the PV equation with t=4, discount rate d = 0.033 and growth rate g = 0); (2) the CVS sales tax for the first 47 years (PV equation with t =47, discount rate d = 0.033 and growth rate g = 0.05); and (3) the non-TIF incremental property taxes for years 5 – 47, discount rate d = 0.033 and growth rate g = 0.05). These three cases use PV equation below, but with different values of ao and g.
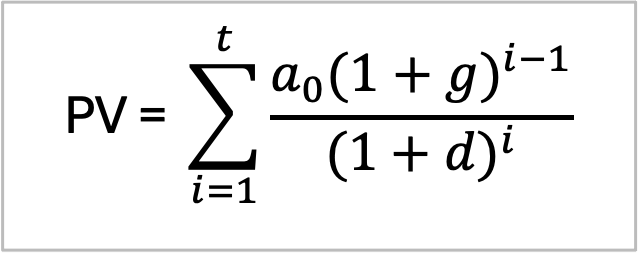
For the TIF property taxes, for example, the first year’s cash flow, ao = $1,500,000, is the same for all four years. So the growth rate g is set to zero, and, as always, the discount rate d is set to 0.033. Note that this equation computes the present value of each year’s cash flow individually, then sums the present value for all years to get the PV of that particular source of funds. Should you want to try out other values for g and d, you can use Microsoft Excel to compute the PV with the following equation:
=SUMPRODUCT(A1 * (1 + B1) ^ (ROW(INDIRECT("1:"&D1)) - 1) / (1 + C1) ^ ROW(INDIRECT("1:"&D1)))
Where ao goes in cell A1, g goes in cell B1, d goes in cell C1 and t goes in cell D1.
Variable Values for Cash Flow
Only the lease agreement with the UCMC falls here. Because the annual cash flow ai varies, the following adapted equation is needed.
For the UCMC lease agreement, g = 0 and d = 0.033. As of 2024, there are 18 years remaining on the land lease, so t = 18. The 18 future cash values are shown in column 7 of the data table; since these are contracted amounts, they do not gain in value, hence g = 0. Column 8 shows the column 7 values discounted at d = 0.033, so they are the present values of each year’s money. Summing these 18 present values yields the present value of the 18 year cash flow. If we plug in the values and parameters to equation 2, we will get the same present value as we get by the hand method, shown in the data table. However, using an equation in Excel we can get the same result with lots less work. This is especially useful in you want to test the sensitivity of the present values for different growth rates g and discount rates d.
=SUMPRODUCT(OFFSET(A2,0,0,D1,1) * (1 + B1) ^ (ROW(OFFSET(A2,0,0,D1,1)) - ROW(A2)) / (1 + C1) ^ (ROW(OFFSET(A2,0,0,D1,1)) - ROW(A2) + 1))
The cash flow values for the 18 years go in column A, from A2 to A19. Or, more generally, for the n years starting at A2 and continuing down column A to A(1+n). As before, g goes in cell B1, d goes in cell C1 and t goes in cell D1. The equation yields exactly the same present value as doing it manually in the data table or using the PV equation.
Estimating the Triangle TIF’s CVS Pharmacy Sales
The CVS Pharmacy & Consumer Wellness Segment, which contains retail pharmacy operations, generated approximately $116.8 billion in revenue in 2023. CVS has approximately 9,000 pharmacies. Since the TIF pharmacy is in the UCMC basement and in central OP, the annual sales are probably a lot higher than the average store, so we assumed it had sales fifty percent greater than the average store. So Orland Park receives an estimated sale tax revenue of approximately $399,000 in 2024. Also, for some time this segment of CVS sales have been growing at about 10% annually, but to be conservative we assume a long term growth of 5% annually. Because this is sales tax revenue rather than property tax revenue, it is not included in the Orland Park TIF accounts. But this revenue is directly the result of the TIF, so we are counting it here.
Choosing d and g Parameters and Estimating Future Sales
To illustrate the models, I selected typical values for the discount rate (d) and growth rate (g) and estimated future drugstore sales based on the average performance of CVS stores nationwide. Ideally, these parameters would be determined by village professionals in collaboration with marketing and financial consultants, using thorough analysis. Finance professionals would rely on the present value method or other models that appropriately account for interest rates and growth when estimating future cash flows. They might also employ econometric techniques and sensitivity analyses to ensure robust projections. Unfortunately, it seems Mayor Pekau chose to perform the estimations himself, without engaging the expertise or tools necessary to produce accurate and reliable results.
This paper was developed by Darold Barnum, with the invaluable assistance of OpenAI's ChatGPT in research and writing. Darold is Emeritus Professor of Management and of Decision Sciences, University of Illinois at Chicago. He holds an MBA in Finance and Industrial Relations, and PhD in Business and Applied Economics, from the Wharton School, University of Pennsylvania. He was Founding Co-director of the University of Illinois Center for Human Resource Management (which partnered corporate HR vice presidents and university faculty), and Associate Director of Indiana University Institute for Urban Transportation. His research and consulting have primarily involved performance of local governments.