Health & Fitness
MA Town-By-Town COVID: Cases Rates Down In 60% Of Cities, Towns
All key coronavirus metrics headed in the right direction, except for deaths. Massachusetts health data showed 47 new COVID-19 deaths.

MASSACHUSETTS — Massachusetts saw three out of four of its COVID-19 metrics head in the right direction, the state's Department of Public Health showed in data released Thursday.
The weekly average case count was 923 daily cases, down from 1,004.1 last week. At the early January peak of the omicron surge, the state reported more than 23,000 average daily cases.
On Thursday, state data showed COVID-19 case rates decreasing in 59.2 percent of Massachusetts cities and towns. In total, 199 Massachusetts towns saw declining case counts, 99 saw an increase, and 38 saw no change.
Find out what's happening in Across Massachusettsfor free with the latest updates from Patch.
The average daily hospitalization rate went from 561.9 hospitalizations last week to 561.4. As of Wednesday, 582 Massachusetts residents were hospitalized with COVID-19, 12 more than last week.
The statewide seven-day positive test rate decreased from 8.05 percent last week to 7.84 percent Thursday.
Find out what's happening in Across Massachusettsfor free with the latest updates from Patch.
At the community level, 149 Massachusetts cities and towns saw their positivity rates increase, 162 saw them decrease, and 25 had no change.
The death rate was the only key coronavirus metric to increase in the Bay State. The weekly death rate was 8.4 deaths per day, compared to 7.7 last week, according to state data.
The Department of Public Health on Thursday reported 8,224 new coronavirus cases in the last week, as well as 47 new deaths and 2,795 vaccine doses administered.
The latest state vaccine report showed the number of fully vaccinated residents rose to more than 5.44 million. Booster doses were given to about 3.19 million residents. Of those boosted, 684,168 received a second booster.
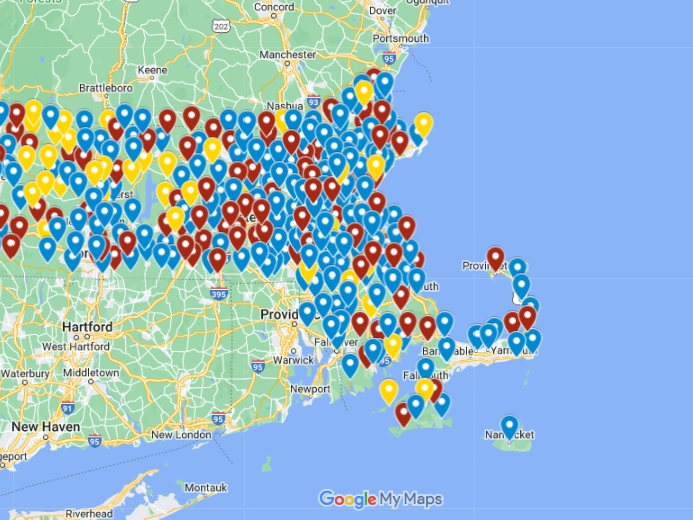
Community-Level Data
To use this map, zoom in and click on a pin to see that community's coronavirus vaccination rate or case numbers. You can also view the town-by-town coronavirus data here
Colors on the map represented if a community's case counts were decreasing, staying the same, or increasing. Blue dots meant a community had a lower case count from the previous week. Yellow meant they stayed the same, and red meant higher.
Other Key Coronavirus Metrics
Of the 582 hospitalized patients, 64 were in intensive care Wednesday, seven more than a week ago, state health officials said. Twenty-four patients were intubated statewide.
According to the Department of Public Health, 30.1 percent of the state's coronavirus hospitalizations over the last week were "primarily" hospitalized for the virus, versus "incidental" cases who tested positive while hospitalized for another reason. Fifty-nine percent of the state's hospitalized patients on Wednesday were vaccinated.
To date, there have been 1,830,211 confirmed cases and 20,025 deaths statewide since the pandemic began.
The state reported 117,195 new tests Thursday, bringing the total administered to more than 46.93 million.
The data included coronavirus cases for all Massachusetts communities, except for those with populations under 50,000 and those with fewer than five cases. The department said the stipulation was designed to protect the privacy of patients in those towns and cities.
The state releases town-by-town testing data every Thursday, including the number of people tested, the testing rate, the positive test rate, cases and infection rates.
Get more local news delivered straight to your inbox. Sign up for free Patch newsletters and alerts.