Health & Fitness
An In-Depth Look at the Housing Market
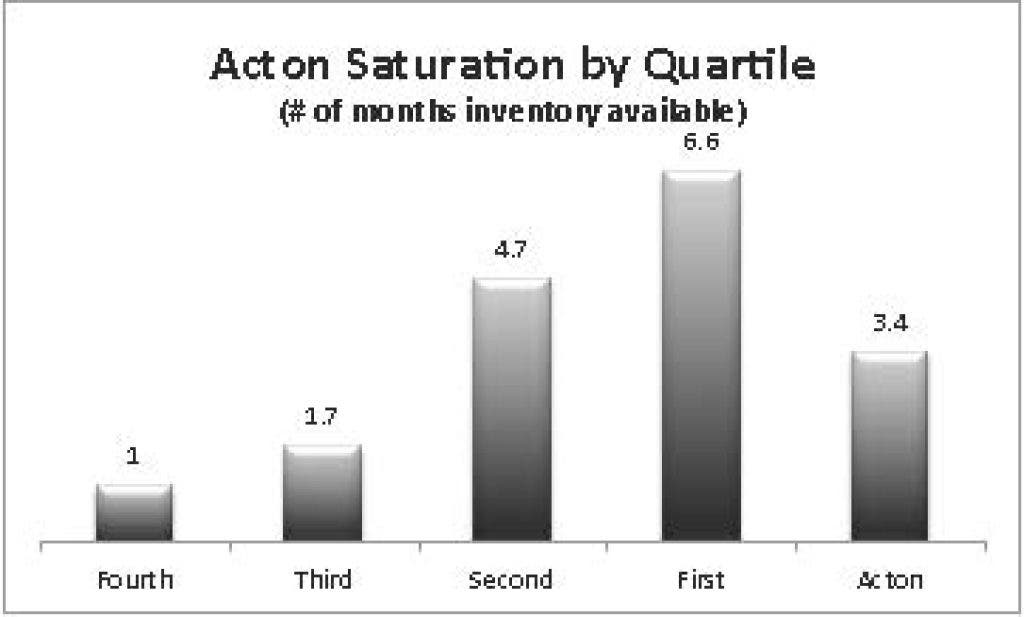
This article looks at the saturation rate in several communities.


This spring real estate market is the most active it's been since 2007. The market has reached the precipice of a sellers’ market in many communities, and in others it has completely transitioned. This is a significant time in the overall recovery for real estate and I have been predicting this for some time.
The buzz right now revolves around inventory levels, or lack there of. In most communities the number of homes available sits at near record lows. A key metric for evaluating a community’s overall heath is the saturation rate, or number of months of inventory available. It is easy to look at the macro number and make a snap judgment about any given location; however, when you dissect the numbers on a quartile-by-quartile basis interesting trends start to emerge.
Massachusetts has many diverse communities and within those communities there is often incredible discrepancy from quartile-to-quartile. What is true for the bottom of the market is rarely true for the high end and vice versa. You have to look at each quartile individually to really understand the overall health of any given community.
Find out what's happening in Concordfor free with the latest updates from Patch.
I have analyzed several communities and Middlesex County as a whole. Several interesting trends have surfaced, which you can see by viewing the charts posted above.
A sellers’ market is typically defined by less than 6-8 months of inventory available, and almost every community surveyed had less than 5 months of real estate available. When you analyze each quartile individually, a strong trend emerges. In almost every case, the high end has more than 8 months of inventory. This doesn’t surprise me as the high end is the last to depreciate and the last to recover after a down turn.
Find out what's happening in Concordfor free with the latest updates from Patch.
*Note: First quartile = top 25 percent of properties, Second Quartile = Upper Middle 25 percent of properties, Third = Lower Middle 25 percent of properties, Fourth = Least Expensive 25 percent of properties.