Health & Fitness
Hingham Real Estate Review and Market Insights First Quarter 2012
Interested in knowing what is going on in the local real estate market? Read my Q1 2012 Hingham Real Estate Review and Market Insights. Sales are WAY UP from a year ago!

Greetings To All and Spring Is In The Air!
After an unprecedented winter with minimal snow and moderate temperatures, I am proud to report spring sprung early for the local real estate market. Sales results are up from a year ago in almost all categories, which is very encouraging.
In the first three months of the year, we have seen new listings come on the market and go under agreement almost immediately and we have seen some bidding wars as well. We are hopeful that is a sign of a positive 2012. There are properties coming on the market daily so if you are a buyer, keep looking and be prepared to make a bid when you find that right property. It is prudent to be pre-approved for a mortgage and Kevin Byrne in our office is an extremely knowledgeable and excellent resource to assist you, www.KevinByrne.com. Fortunately, interest rates are still low but they have started to climb. If you are a potential seller, NOW is the time to list your home for sale.
If you have any questions about the local real estate market or would like to discuss purchasing or selling a home, I am just a phone call or a click away.
Find out what's happening in Hinghamfor free with the latest updates from Patch.
Sincerely,
Pam Bates
Find out what's happening in Hinghamfor free with the latest updates from Patch.
Coldwell Banker Residential Brokerage
c: 617 240-1292
Hingham Real Estate Q1 2012 Summary
What a Difference A Year Makes....
The results for first quarter 2012 are much improved over the same time period in 2011. In Hingham single family home sales totaled over $27.8 million in January-March 2012 versus $17.6 million for the same period in 2011. This is an increase of over 57%! In Q1 2012 there were 36 homes sold versus 26 in Q1 2011. This is an increase of 38%
In Q1 2012 the average days on the market was 129 days which is a decrease of over 50% from last year. The sales price to listing ratio is stable at 95%. Finally, the median home price of $788,500 is up by over 28% and the average sale per square foot of $294 is up by 13.5%! Keep in mind that January-March has typically the lowest volume of sales versus any other quarter during the year but clearly the results are tremendously encouraging.
Currently there is a 12-month inventory of homes available, which is higher than typical for early spring. However, because of favorable weather this winter, many sellers decided to list homes in February and March rather than wait until the typical 'spring market'. While the sales results so far favor sellers, the current inventory levels are more buyer favored. In general, we are trending toward a more balanced market, favoring neither buyers nor sellers, than we have seen in the past few years.
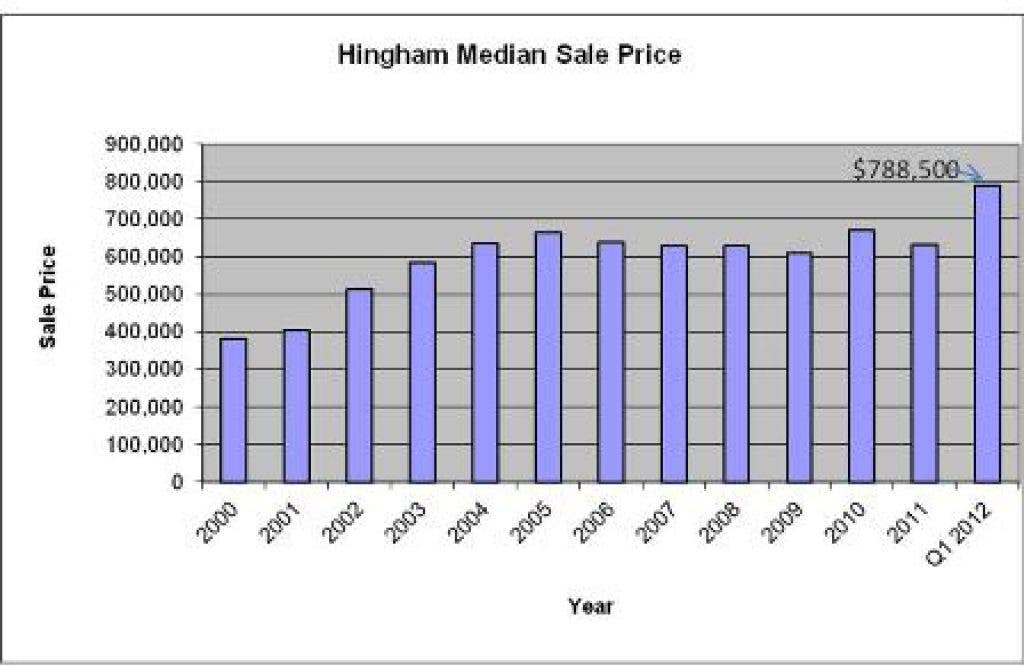
A 12-Year Perspective....
While national sales figures show significant declines in home values, our local real estate market has held its own with slight variations in home values over the past seven years.
Hingham Median Sale Price
Year Median Sale Price
2000 $382,000
2001 $405,000
2002 $512,000
2003 $582,000
2004 $635,000
2005 $665,000
2006 $638,700
2007 $628,500
2008 $630,000
2009 $610,000
2010 $670,000
2011 $631,000
Q1 2012 $788,500!
You can view this information in a bar chart by clicking on the photo above.The median home sale price in Hingham during the past 12 years has ranged from $412,000 in 2000 to a high of $788,500 in Q1 2012! Admittedly this is measuring just a 3-month period but Q1 2011 median sale price was $612,400. WOW -a 29% increase from a year ago!
If you would like to read my entire newsletter with even more information about the Hingham real estate market, click here .I welcome your questions and comments!
-Pam Bates
Coldwell Banker Residential Brokerage, Hingham
c: 617 240-1292