Health & Fitness
Hingham Real Estate Review and Market Insights Third Quarter 2011
Interested in knowing what is going on in the Hingham real estate market? I am a realtor for Coldwell Banker Hingham and this blog features highlights of my quarterly real estate newsletter.

Greetings all~ Here we are in October and I must admit the fall is my favorite season in New England. Warm days and cool nights, lots of sun (and a few rainy days too) but overall pretty delightful. Unfortunately the real estate results to date are sluggish with overall results off from a year ago. However, there are some encouraging trends, particularly in the area of median sale price. I have provided a detailed analysis of the local market below. If you have any questions about the Hingham market or would like to discuss purchasing or selling a home, I am just a phone call or a click away.
Pam Bates c:617 240-1292 e:pamela.bates@nemoves.com
Hingham Real Estate Q1-3 2011 Summary
Find out what's happening in Hinghamfor free with the latest updates from Patch.
Sales are Sluggish
Hingham single family home sales totaled over $152 million 2010 vs. $132 million for the same period in 2011. This is a reduction of approximately 14.5% vs. the prior year. In 2010 there were 209 homes sold during Q1-3 2011 vs 187 in 2011. This is a reduction of 11.8%. It is worth noting that in Q1-2 2010 there were still government home buying incentives in place which fueled some of our sales, particularly for first time home buyers.
Find out what's happening in Hinghamfor free with the latest updates from Patch.
In Q1-3 2011 the average days on the market was 139 days, which is an increase of 23% from the previous year. The sales price to listing ratio is stable at 96%. Finally and perhaps most importantly, the median home price increased from Q1-3 2010 to Q1-3 2011 by 2.4% to $640,000!
While Q1-3 results are sluggish, it still appears that Hingham home values have stabilized. Inventory levels are the same as compared to the same period in 2010. The is a 10+ month supply of inventory. Typically real estate experts consider it to be a balanced market when there is a 6 month inventory available. At this point, the scale is still tipped in the direction of a buyer's market.
With national sales figures showing significant decline in home values, our local real estate market is holding its own with slight variations in home values over the last six years.
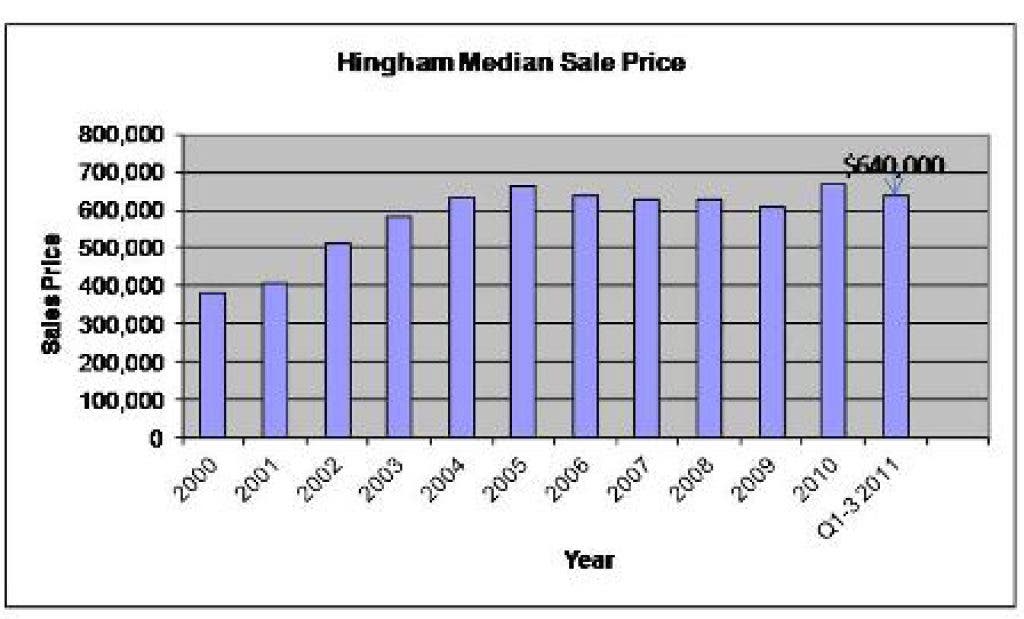
Hingham Median Sale Price
Year Median Sale Price
2000 $382,000
2001 $405,000
2002 $512,000
2003 $582,000
2004 $635,000
2005 $665,000
2006 $638,700
2007 $628,500
2008 $630,000
2009 $610,000
2010 $670,000
Q1-3 2011 $640,000
You can view this information in a bar chart by clicking on the photos above.
The median home sale price in Hingham during the past 10 years has ranged from $412,000 in 2000 to a high of $670,000 in 2010. January-September 2011 showed a median sale price of $640,000.
If you would like to read my entire newsletter with even more information about the Hingham real estate market,click here.
I welcome your questions and comments!
-Pam Bates, Coldwell Banker Residential Brokerage Hingham