Health & Fitness
Hingham Real Estate Review and Market Insights-Year End 2011
Interested in knowing about the Hingham Real Estate Market? Read my blog and link to my quarterly real estate review and market insights for up to the minute local information and statistics.

Greetings All and Happy New Year! It is hard to believe the photograph above is January but New England weather can be unpredictable. Here we are in mid-January with no appreciable snow so far.
The trend we saw mid-year in 2011 continued through year end with real estate results sluggish and overall results off from a year ago. For Hingham, 2010 was a surprisingly good year and in part it may be that 2011 just could not compare.
In the first two weeks of January, we have seen new listings come on the market and go under agreement almost immediately. We are hopeful that is a sign of a positive 2012. There are properties coming on the market daily so if you are a buyer, keep looking. Fortunately, interest rates are still amazingly low. If you are a potential seller, consider preparing your home for sale and listing your home before the spring market when there are buyers shopping but not a lot of inventory available.
Find out what's happening in Hinghamfor free with the latest updates from Patch.
If you have any questions about the local real estate market or would like to discuss purchasing or selling a home, I am just a phone call or a click away.
Pam Bates c :617 240-1292 e:pamela.bates@nemoves.com
Find out what's happening in Hinghamfor free with the latest updates from Patch.
Hingham Real Estate Year End 2011 Summary
Sales are sluggish
Unfortunately 2011 results fell short when compared to 2010. In Hingham single family home sales totaled over $167 million in 2010 versus $149 million for the same period in 2011. This is a reduction of approximately 12.2%. In 2010 there were 217 homes versus 211 in 2011. This is a reduction of 2.8% It is worth noting that in Q1-2 2010 there were still government home buying incentives in place which fueled some of our sales, particularly for first time home buyers.
While 2011 results are sluggish, over time Hingham home values are continuing to hold their own. Currently there is a 6.5 month inventory available, which is typical for January. Inventory will start to increase as we approach spring. Typically real estate experts consider it to be a balanced market when there is a 6-month inventory available. At this point, the scale is still tipped in the direction of a buyer's market.
While national sales figures are showing a significant decline in home values, our local real estate market is holding its own with slight variations in home values over the past seven years.
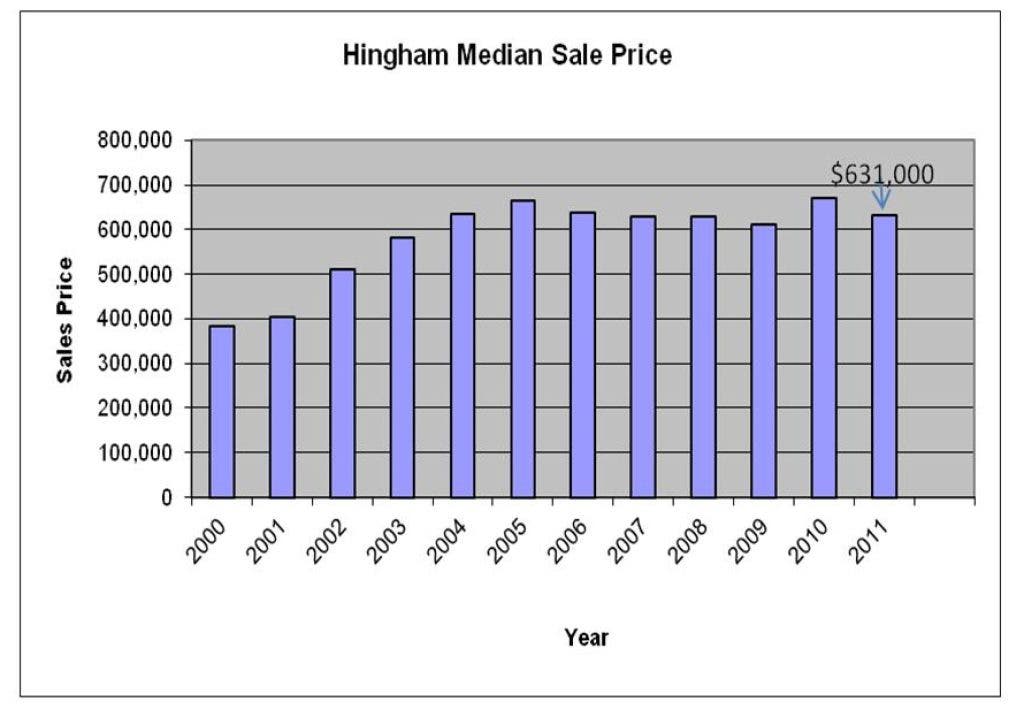
Hingham Median Sale Price
Year Median Sale Price
2000 $382,000
2001 $405,000
2002 $512,000
2003 $582,000
2004 $635,000
2005 $665,000
2006 $638,700
2007 $628,500
2008 $630,000
2009 $610,000
2010 $670,000
2011 $631,000
You can view this information in a bar chart by clicking on the photos above.
The median home sale price in Hingham during the past 10 years has ranged from $412,000 in 2000 to a high of $670,000 in 2010. 2011 showed a median sale price of $631,000.
If you would like to read my entire newsletter with even more information about the Hingham real estate market, click here.
I welcome your questions and comments!
-Pam Bates, Coldwell Banker Residential Brokerage Hingham