Neighbor News
December vs. April: What Changed in the Special Election?
Analyzing the shift in voter sentiment between the April 1 and December 9 override elections, and how the true will of the voters was found.

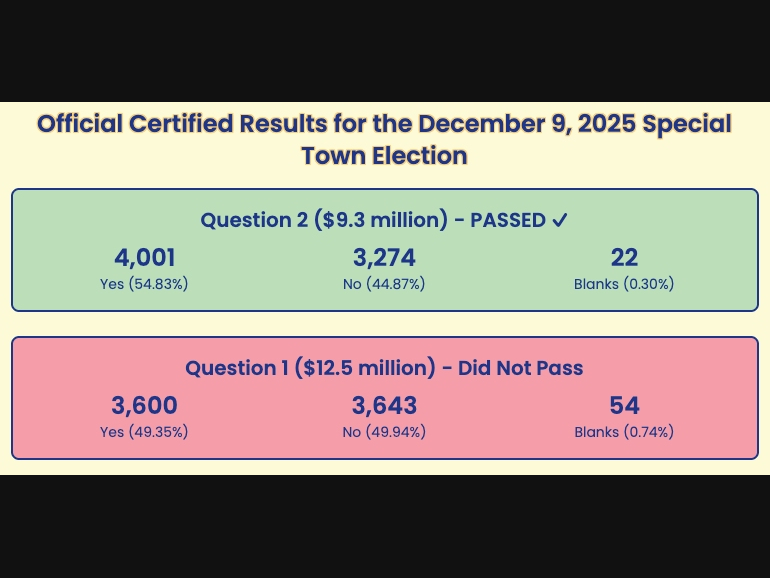
On December 9, 2025, Stoneham voters returned to the polls for a special town election featuring two crucial override questions. The results showed a shift in voter sentiment compared to the April 1, 2025 election. Here's a breakdown of how the electorate changed between the two elections, and how Stoneham's leaders demonstrated their responsiveness to community feedback.
Stoneham Listened
After the April election, town leaders went back to the drawing board to address the concerns of voters. By reducing the override amount and refining the plan, they presented a more palatable option that resonated with the community. The results speak for themselves: when leaders listen and voters engage, positive change follows.
Find out what's happening in Stonehamfor free with the latest updates from Patch.
| Override Vote | Yes % | Vote Margin |
|---|---|---|
| April - $14.6m | 45.5% | -523 votes |
| December - $12.5m | 49.3% | -43 votes |
| December - $9.3m | 54.8% | +727 votes |
From April to December:
- +9.3% Yes vote increase
- +1,092 votes more Yes votes
- +899 voters turned out
When leaders listen and voters engage, good things happen.
Find out what's happening in Stonehamfor free with the latest updates from Patch.
We the People
The voters have spoken loud and clear: they want responsible funding for our schools and senior center, and they want it now. Despite turning down a larger override in April, the community came together in December to approve a more focused and manageable $9.3 million override.
This override election had the largest turnout of any municipal election in recent memory, demonstrating the community's commitment to shaping the future of Stoneham. The passage of the $9.3 million override by a significant margin shows that the voters have spoken decisively.
- +1,250 vote swing from April to December
The will of the people was heard—loud and clear!
A Clear Ballot
There were concerns that voters were confused by having two distinct override questions on the ballot and a fear that voters would not realize that Question 1 and Question 2 were separate items. This was proven false by the results: Stonehamites not only understood to answer both questions, but they understood they can choose differently on each question based on their priorities.
| Override Vote | Yes Votes | No Votes | Result |
|---|---|---|---|
| December - $12.5m | 3,600 | 3,643 | Failed by 43 |
| December - $9.3m | 4,001 | 3,274 | Passed by 727 |
If voters were confused, both questions would have similar results.
- 401+ voters deliberately voted NO on Q1 and YES on Q2
- 0.7% left Q1 blank
- 0.3% left Q2 blank
That's not confusion. That's sophistication.
Every Precinct Swung Yes
Each precinct experienced a significant swing toward the Yes vote, demonstrating widespread support for the override across the entire community. This uniform shift highlights a clear message from all of Stoneham's neighborhoods: they are ready and willing to support responsible funding for our departments.
| Precinct | April Yes % | December Yes % | Swing |
|---|---|---|---|
| P1 | 48.4% | 58.7% | +10.3pp |
| P2 | 44.8% | 56.3% | +11.4pp |
| P3 | 44.6% | 54.8% | +10.2pp |
| P4 | 44.4% | 54.6% | +10.2pp |
| P5 | 45.2% | 52.1% | +6.9pp |
| P6 | 48.5% | 55.5% | +7.0pp |
| P7 | 42.7% | 52.9% | +10.3pp |
- +11.4pp - Precinct 2 swing (biggest)
- 7/7 precincts swung toward Yes
The message resonated everywhere.
Every Generation Showed Up
Voter turnout increased across all age groups from April to December, demonstrating a community-wide commitment to participating in Stoneham's future. The significant rise in engagement among younger voters, coupled with strong turnout from seniors, highlights a collective dedication to civic duty across generations.
| Age Group | April Turnout % | December Turnout % | Increase |
|---|---|---|---|
| 18-24 | 14.3% | 22.0% | +7.7pp |
| 25-34 | 18.9% | 22.2% | +3.3pp |
| 35-44 | 39.5% | 45.4% | +5.9pp |
| 45-54 | 45.6% | 48.4% | +2.8pp |
| 55-64 | 43.6% | 46.0% | +2.4pp |
| 65+ | 41.6% | 49.6% | +8.0pp |
- +7.7pp - 18-24 turnout jump (biggest increase)
- 49.6% turnout - 65+ turnout (highest rate)
Young voters surged. Seniors led the way. Everyone participated more.
New Voters: All Ages
This wasn't just a return of the April voters—1,777 new voters participated in December. They came from all age groups, showing a broad-based enthusiasm for the override. Notably, seniors made up the largest share of new voters, underscoring their commitment to supporting essential town services.
| Age Group | New Voters |
|---|---|
| 18-24 | 145 |
| 25-34 | 216 |
| 35-44 | 298 |
| 45-54 | 243 |
| 55-64 | 281 |
| 65+ | 594 |
| Total | 1,777 |
Seniors Showed Up
Despite concerns that seniors wouldn't be able to turn out during a December election, Stoneham's older residents proved once again that they are deeply invested in the future of our community and showed up in strong numbers to support our town!
| Metric | April | December | Change |
|---|---|---|---|
| Turnout Rate | 41.6% | 49.6% | +8.0pp |
| Number of Voters | 2,121 | 2,529 | +408 voters |
- +408 voters - more seniors voted in December
- 594 voters - seniors voted in Dec who skipped April
- 34.7% of Dec voters were seniors (vs 33.2% in April)
Seniors showed up at higher rates than in April.
Every Precinct Showed Up
Voter turnout increased in every precinct from April to December, highlighting the community's growing engagement and commitment to shaping Stoneham's future. The sweeping victory across all precincts underscores the collective desire for positive change.
| Precinct | April Turnout % | December Turnout % | Increase |
|---|---|---|---|
| P1 | 31.0% | 33.6% | +2.6pp |
| P2 | 33.8% | 37.8% | +4.0pp |
| P3 | 41.6% | 48.9% | +7.3pp |
| P4 | 35.7% | 37.6% | +1.9pp |
| P5 | 41.6% | 45.1% | +3.5pp |
| P6 | 37.7% | 43.2% | +5.5pp |
| P7 | 42.0% | 43.2% | +1.2pp |
- Precinct 3: +7.3pp - Biggest turnout increase
The December 9 election results underscore the importance of community engagement and responsive governance. Stoneham voters made their voices heard, and town leaders took note, adjusting their proposals to better align with the community's priorities. This election serves as a powerful reminder that when citizens actively participate in the democratic process, meaningful change can occur.
This analysis is based on publicly available data from the Town of Stoneham, including official election results, voter registration records, and assessor property records. Demographic categorizations represent reasonable estimates based on available public records and may not reflect 100% precision due to data limitations and privacy protections.
This article was originally posted to SaveOurStoneham.org. The original article also contains way cooler infographics.