Health & Fitness
The ability to see raw numbers in police crime data matters
I wish the Watertown Patch had pushed Chief Deveau further to better explain his comments and stats mentioned in the Watertown Police Dept. is Fighting Rising Crime Rate with a Smaller Force piece.

Yesterday I read the Patch article on this website. After I read the article I wish , the reporter for the Watertown Patch had pushed Chief Deveau further to better explain his comments and stats mentioned in the piece.
I found the statements made by the Chief that referenced Columbine hyperbolic and unnecessary. “At the high school, you can identify troubled kids and work with them, so you can get through to them before – God forbid – it becomes an Columbine situation.”
I wish Charlie had followed up with the Chief about his purpose in invoking the images of children climbing out of windows with armed SWAT officers nearby. I also would have like to see Charlie ask the Chief to provide data that would support the argument that having school resource officers in high schools prevents school shooting and rampage events.
Find out what's happening in Watertownfor free with the latest updates from Patch.
While I found the Columbine statements manipulative - the more dangerous statement that wasn't fact checked or presented with more context and supporting data was the referencing of percentages by the Chief to support his argument that the Watertown Police Department needs additional town funds to keep patrol staff at a level that prevents crime.
Percent increases without raw numbers can be incredibly misleading. So I got curious when I saw the Chief reference 100 percent increases in rape over 2010, 86 percent increases in robberies over 2010 and a 16 percent increase in assaults from 2010.
Find out what's happening in Watertownfor free with the latest updates from Patch.
A 100% increase in rapes is a serious event - we need more officers. Or is it?
Based on the aggregated statistics provided by the WPD on their website http://www.watertownpd.org/statistics/stats.html the actual number increases look like this:
- 4 rapes in 2010
- 13 robberies in 2010
- 172 assaults in 2010
Based on the percent increases (it isn't clear if those persent's are a projection or actuals) as stated by the Police Department the actual increases look like this:
- 8 rapes in 2011
- 24 robberies in 2011
- 199 assaults in 2011
The Chief doesn't define what "total crime" is and the WPD website doesn't either so I'm not going to include that in the 2011 actuals. So the scary 100 percent increase represents an actual increase in numbers of 4. Obviously we don't want to see any increases in rapes but saying an increase of 4 to 8 has a much different feel than a "100 percent increase." Raw actual numbers for a single year can be interesting but trends in actual numbers are even more useful. We should answer the following questions:
- How have the incident numbers for different crimes changed over time?
- How has the staffing of patrol officers changed during that same time period? (I will ask the WPD to provide that information)
- How many of these incidents led to arrests? (I will ask the WPD to provide that information)
- How many of the arrests led to convictions? (I will ask the WPD to provide that information)
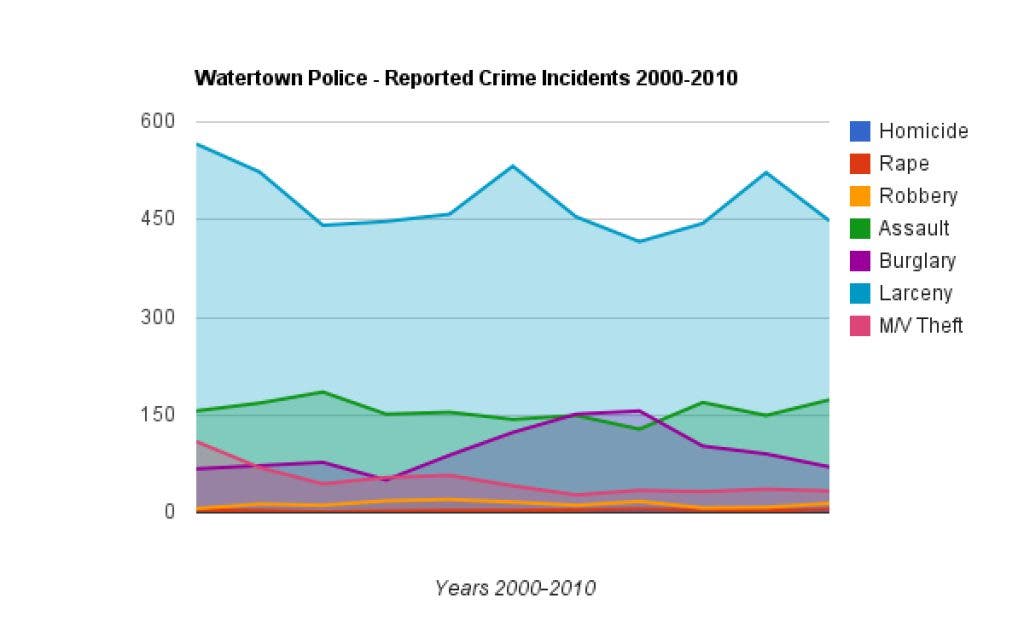
Trending reported crime incidents
Time for data visualization! We will use the high level, aggregated data provided by the police department on their website. Ideally we'd use line item level incident reports to generate this data but until the Watertown Police Department answers my Freedom of Information Request to get access to the raw daily log data we'll have to rely on the summed numbers they provide. I used the data provided on the WPD stats section of their website to generate the trending chart below.
The chart below shows how the incidents like Homicide, Rape, Robbery, Assault, Burglary, Larceny and Motor Vehicle Theft have changed during the 2000-2010 period. There is also a larger and interactive version of this chart available. The charts are associted with this post above.
The result of graphing this data over time? Crime is about the same as it has been over a 10 year period and actually down slightly for some incidents types over the past 3 years. While a jump of 2x in rapes should be looked into – how many of those will lead to arrests and convictions are two important questions.
So our crime incidents haven't changed drastically over a 10 year period so while the Chief has stated that "The department, however, lost four officers in fiscal 2009 and another four the following year. That reduced the number of patrol officers from 55 to 47" the crime reporting data indicates that as community our crime has not spiked as a result of those reductions. That leads me to want to understand Police Department staffing model changes during this same 10 year period. Given that our crime report data has remained relatively stable during these previous 10 years that would indicate that our reductions in force have little impact on reported crimes.
What the data does show is that there has been a drop in arrests during this period.
Reports and Arrests
There has been a decrease in crime reports during the period and at first blush, seeing the number of arrests going from a high of 737 in 2000 to a low of 418 in 2010 seems like cuts in the Police Department have had a big impact on arrests. What we need to do is place both crime reports and arrests on the same trending chart to see how both have changed over time.
The trending chart above does that.
Notice that both of the trending lines follow a similar path so that as crime reports have decreased so have arrests. It would help to have the ability to overlay police department staffing trends on this graph so we could better understand the connections between department staffing levels, reports, arrests and convictions.
Summary
While I think having access to more specific Police Department data will help us as citizens make more informed decisions about funding our public safety offices, what will be needed is the ability to compare Watertown, MA data with our surrounding communities. I hope to see our police employees start providing information to the public in the same way as our Town Auditor is required by law to report municipal financial data and our School District is required to report data to the Department of Education.
Thanks,
Matt