Health & Fitness
2013 New Listings - Maple Grove Real Estate Supply
2013 January & February Home Listings (Supply) continue to show that Maple Grove residents may not be willing, or be required to take the drop in values any longer.

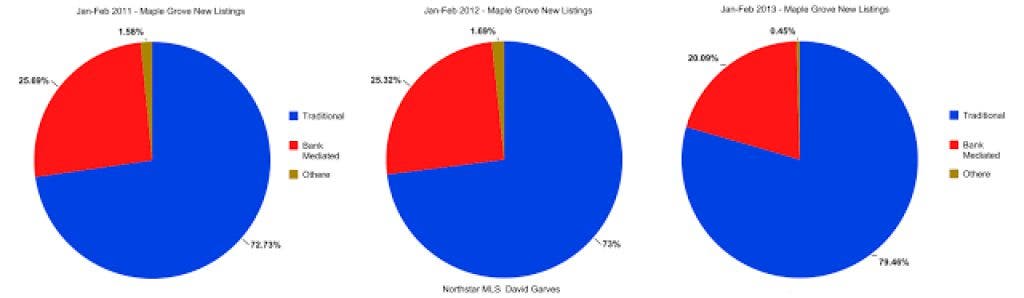


More good signs for home owners in Maple Grove as supply/demand economics continue to prove what we all learned in Econ 101. While other variable such as the jobs market, bank mediated (foreclosures and short Sales) home sales, and consumer confidence play a role in home prices, supply and demand seem to always remain as the strongest predictors of the price to sell your home.
While comparable sold home (demand) numbers wont be available for a week, 2013 January & February home listings (supply) continue to show that Maple Grove residents may not be willing, or be required to take the drop in values any longer. For the second year in a row, the number of Maple Grove Home listings have dropped year over year about 6% during the combined months of January and February. <see Chart: Jan-Feb Listings>.
The 224 homes listed during the months of January & February 2013 is in fact the lowest number since Prince had us signing in the new millennium. Only 209 homes where listed throughout the first two months of 2000, of course that was the year the Nottingham neighborhood was being established, and The Shoppes at Arbor Lakes hadn't even broken ground yet. Maple Grove has come a long way since then.
In addition to simple supply and demand economics, Maple Grove is finally seeing a reduction of the bank mediated homes (foreclosed and short Sales) which are most often associated with driving down values and the drop in real estate across the country since 2006. Even with the overall supply of new listings dropping, Maple Grove is seeing a smaller percentage of the listings being bank mediated. While the number of traditional homes has remained consistent over the last three years with 178 in 2013 compared to 184 & 173 in 2012 & 2011 respectively, the percentage of bank mediated homes has been the largest reason for the reduction of homes on the market. < see chart: Jan-Feb Traditional>
So what does this all mean to home owners in Maple Grove? The power to begin increasing the asking price we sell our homes for!
Find out what's happening in Maple Grovefor free with the latest updates from Patch.
Over the last three years we've seen steady increases in the list price of homes in Maple Grove with 2013 showing a 12% increase in the asking price of a home in Maple Grove (both median and average) compared to 2012, and more than a 20% increases compared to the first two months of 2011. < see chart: Jan-Feb List Price >
Next week, we'll complete the supply and demand theory when sales number are completed. One thing seems certain however - Although interest rates remain low and prices are still "on sale", the people that are still waiting for the bottom, and the best deals in real estate, you may have missed them.
David J. Garves
www.maplegroverealestateinfo.com
dgarves@themlsonline.com
Want to do your own research? Get the latest info @ DO YOUR OWN RESEARCH