Health & Fitness
2013 Sold Homes - Early 2013 Numbers Show Interesting Contrast for Buyers and Sellers
While the battle for "best deal" shoppers and "fair value sellers" continues in Maple Grove, the home sales figures show some intersting data about demand in our housing market.


So far in 2013, most reports concerning Maple Grove home sales (demand) may look bleak.
From January's drop in the average and median price of sold homes 10% & 14.5% respectively, to February's drop in the number of homes sold by 9% from 64 in 2012 to 57 this year, there's plenty of information that looks concerning. It's important though to look a little deeper into the numbers as the market continues to recover from the foreclosure and short sales that have driven prices down and hurt buyer confidence. A complete move from buyers market to one that's a sellers market wont happen over night, and as the battle between buyers wanting an amazing deal vs. sellers wanting a fair price continues - there seems plenty of time to dig deeper into the numbers and see what's actually happening.
Find out what's happening in Maple Grovefor free with the latest updates from Patch.
FEBRUARY COMPARISON
Let's begin by digging in and looking at that 9% drop in home sales for February in Maple Grove. No doubt, not the numbers we want to see to try and determine strength in the market, but it's important to compare apples to apples and see where the drop off of sales comes from. For months, we've seen a decrease in the amount of sheriff sales, and bank mediated properties coming onto the market. February sales seem directly effected by the lack of "distressed" home listings taking place in Maple Grove. There was a sharp drop off in bank mediated sSales (short sales and foreclosures) from a February 2012 mark of 33 (52% of total sales), to 18 (32% of total sales) in 2013. With 15 fewer bank mediated sales, this accounts for more than double the amount of decrease in home sales for February. While eliminating the bank mediated sales has been the most important item needed to return to "normal" in the market, let's look at what the numbers say about the remaining Traditional Sales that took place for February:
Find out what's happening in Maple Grovefor free with the latest updates from Patch.
2012
2013
+/-
# of Sales (Traditional)
31
39
25.80%
Average Price (sold)
$264,712.00
$307,390.00
16.00%
Price Per Sq./Ft (sold)
$108.34
$112.97
4.00%
A traditional home owner thinking of selling their home in 2013 not only saw an increase in the amount of sales happening in February, but also a 16% increase in average price compared to 2012. Unless your a bank who likes selling properties, or buyers shopping for the absolute cheapest deals, a deeper look into February numbers seems to show even more indications that Maple Grove home owners are finally seeing a little strength in their home values.
YEAR TO DATE COMPARISON
So what about those year to date numbers and the January drop in sales price? Similar to the February data, year to date total sales are down slightly, but the numbers show traditional sales increased 23% from 62 sales in 2012 to 76 sales in 2013. A very good sign for home owners in Maple Grove, but we aren't done digging yet. What about the values of the homes that are selling. Why is the average price so slow to increase if all the information is so strong?
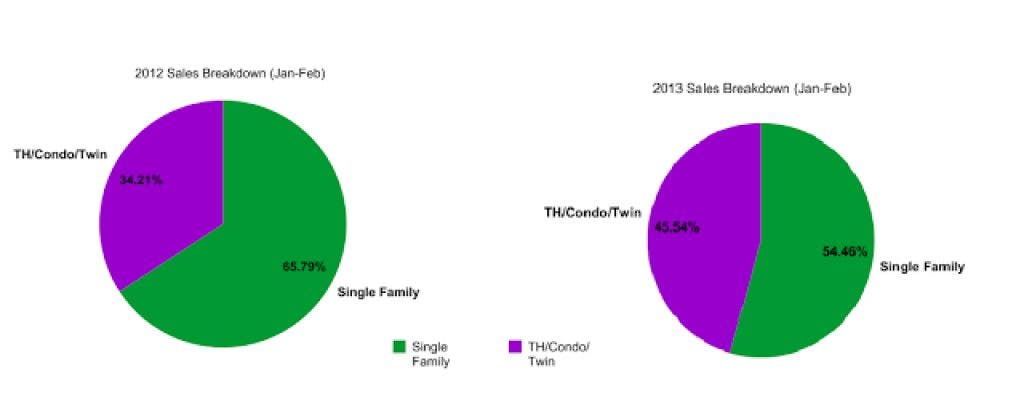
First, it's important to look at the types of homes that are selling. Even as home sellers of single family properties in Maple Grove begin to trust the values of today's market - the home buyers are increasingly still purchasing homes often considered "starter homes". 2013 saw an increase in the percentage of town homes, condo's and twin homes to nearly 46% of the total market so far this year compared to only 34% of sold homes for this time period in 2012 < See YTD Sale by Type Chart >
With an increasing percentage of homes sold falling into the lower priced "starter homes" it pulls down the average of all homes sold, keeping it from rising as much as predicted. By separating the data into types of property, we can get a better look at what's really going on with the average sales price of Maple Grove properties < See YTD Price by Type Chart >
By separating the data, we get a clearer look and see that single family homes, while a smaller percentage of all sales, actually have an average sales price that's increasing by nearly 20%. Similarly the town home, condo, and twin home market, even while acting as an anchor on total average sales price, also shows an increased by over 13% year over year when only comparing it to similar homes last year.
Buyers shopping for the best deals are still prevalent in this market. Additionally many home sellers are out of practice accepting offers contingent on the sale of buyers homes, meaning it's difficult for "move up" buyers to negotiate home purchases on higher priced homes. Both sides must move closer together before we return to "normal", still our Maple Grove market continues to show improvement and even strength. Now if we can just get the snow to melt and spring to actually come - we'll see how leaves, green grass and tulips help sell homes.
David J. Garves
www.maplegroverealestateinfo.com
Want to do your own research? Get the latest info @ DO YOUR OWN RESEARCH