Real estate statistics can be a little confusing. Often you will hear statistics that are based on one month but sometimes they are year to date statistics. Is there a difference, you might ask? Yes, there can be a fairly large difference. So what does it all mean?
Here is a good example. This first batch of numbers is the Year to Date activity that covers all of this year up until the end of September. The second set of numbers compares this September to last September.
Maple Grove Housing Statistics, September 2013 YTD: new listings up +16.6% at 1452 units, closed sales up +10.7% at 1013 units, median sale price up +5.4% at $231,500, average sale price up +7.1% at $277,394, price per sq ft up +7.2% at $113, percent of original list price received up +2.5% at 97.0% of original list price, days on market down -36.9% at 70 days.
Find out what's happening in Maple Grovefor free with the latest updates from Patch.
Notice that both the median and average sale prices show an increase in the year to date numbers (above), but the monthly statistics (below) show a decrease in both the median and average sale prices.
Maple Grove housing statistics September 2013: new listings up +7.2% at 149 units, closed sales up +19.3% at 105 units, median sale price down -13.2% at $214,900, average sale price down -12.0% at $248,110, price per sq ft down -0.2% at $109 per sq ft, percent of original list price received at closing up +1.1% at 97.1% of original list price, days on market until sale down -22.7 at 58 days, inventory of homoes for sale down -2.1% at 328 units, and months' supply of inventory down at 3.0 months' supply.
Find out what's happening in Maple Grovefor free with the latest updates from Patch.
So why are these 2 sets of statistics so different? The monthly numbers are more likely to be affected by little ups and downs in the interest rates, the weather, and other seasonal or short term factors. The year to date numbers are less affected because you are looking at a much larger sample size and over a longer period of time.
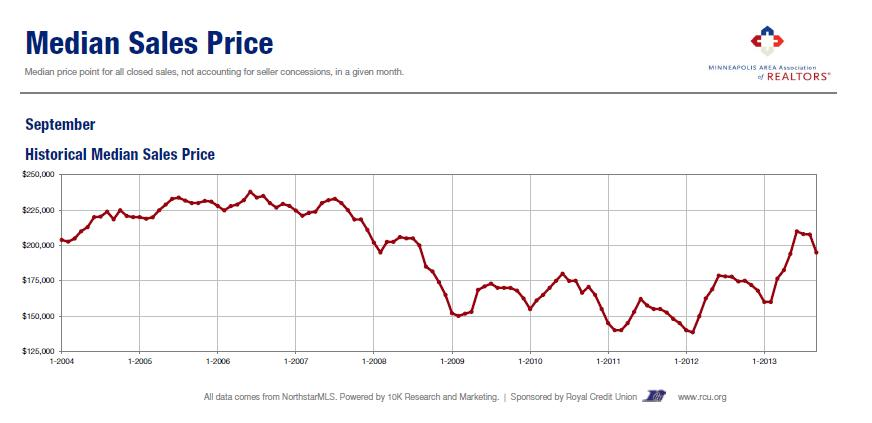
This spring was a good example of how weather can affect the statistics. We had a late spring and there was still snow on the ground in March and April. In Minnesota, some home buyers tend to hold off on house hunting until the snow melts off of the roofs, especially if they are looking at pre-existing homes. In March and April 2013 both the median and average sale prices were down in Maple Grove. But they shot up substantially in May once the snow had melted.
So while it is good to stay on top of things, you shouldn't be overly concerned about the fluctuations in monthly statistics. There is always more to the story than just the headlines. The image above (Courtesy of the Minneapolis Area Association of REALTORS® and Royal Credit Union and based on data from the NorthstarMLS) is an illustration of how seasonal changes affect the Twin Cities market. Prices tend to fall off in the autumn and winter months and then rebound in the spring and summer months.
For more real estate information, check out the House Hunting Hound website. http://www.househuntinghound.com/