Politics & Government
5 Maps That Show Minnesota's Changing Political Landscape
Political races are often framed as rural vs. urban, or small town vs. big city. But that wasn't always the case.


MINNESOTA — In current politics, it seems there's one piece of conventional wisdom that remains true every election; rural and exurban areas vote Republican, urban and suburban areas vote Democratic.
A brief look at a results map shows that the 2022 governor's election followed that trend. Out of the 87 counties in Minnesota, Democrat Tim Walz only won in 13 of them.
Despite that, Walz handily defeated the Republican challenger, with his 52.27 percent (1,312,311 votes) to Scott Jensen's 44.61 percent (1,119,911). That's because Walz's win were in counties that dwarf the populations of counties where Jensen won.
Find out what's happening in Minneapolisfor free with the latest updates from Patch.
Hennepin County alone is home to 1.2 million people, and Walz won more tha 70 percent of the votes cast there.
Meanwhile, Jensen ran up the totals in every other part of the state except for the northwest angle, but it wasn't enough to overcome Walz's wins in the Twin Cities metro counties.
Find out what's happening in Minneapolisfor free with the latest updates from Patch.
Believe it or not, the rural-urban divide in Minnesota wasn't always so stark. Some suburban counties were won by Republicans, and some rural counties were won by Democrats.
Democrat Collin Peterson represented Minnesota's 7th District in Congress for decades until he was ousted by Michele Fischbach, a conservative, Donald Trump-backed Republican.
The late Democrat Jim Oberstar represented Minnesota's Iron Range in the 8th District. until he was beaten by a Republican in the 2011 midterm elections.
And Democratic candidates for governor used to regularly win rural counties, while Republican candidates could win suburban counties.
But that slowly shifted over the past two decades.
The maps below show the results from the past five gubernitorial elections. See how the rural-urban divide became entrenched during that period:
2006
- Republican Tim Pawlenty: 1,028,568 (46.69 percent)
- Democrat Mike Hatch: 1,007,460 (45.73 percent)

2010
- Republican Tom Emmer: 910,462 (43.21 percent)
- Democrat Mark Dayton: 919,232 (43.63 percent)

2014
- Republican Jeff Johnson: 879,257 (44.51 percent)
- Democrat Mark Dayton: 989,113 (50.07 percent)

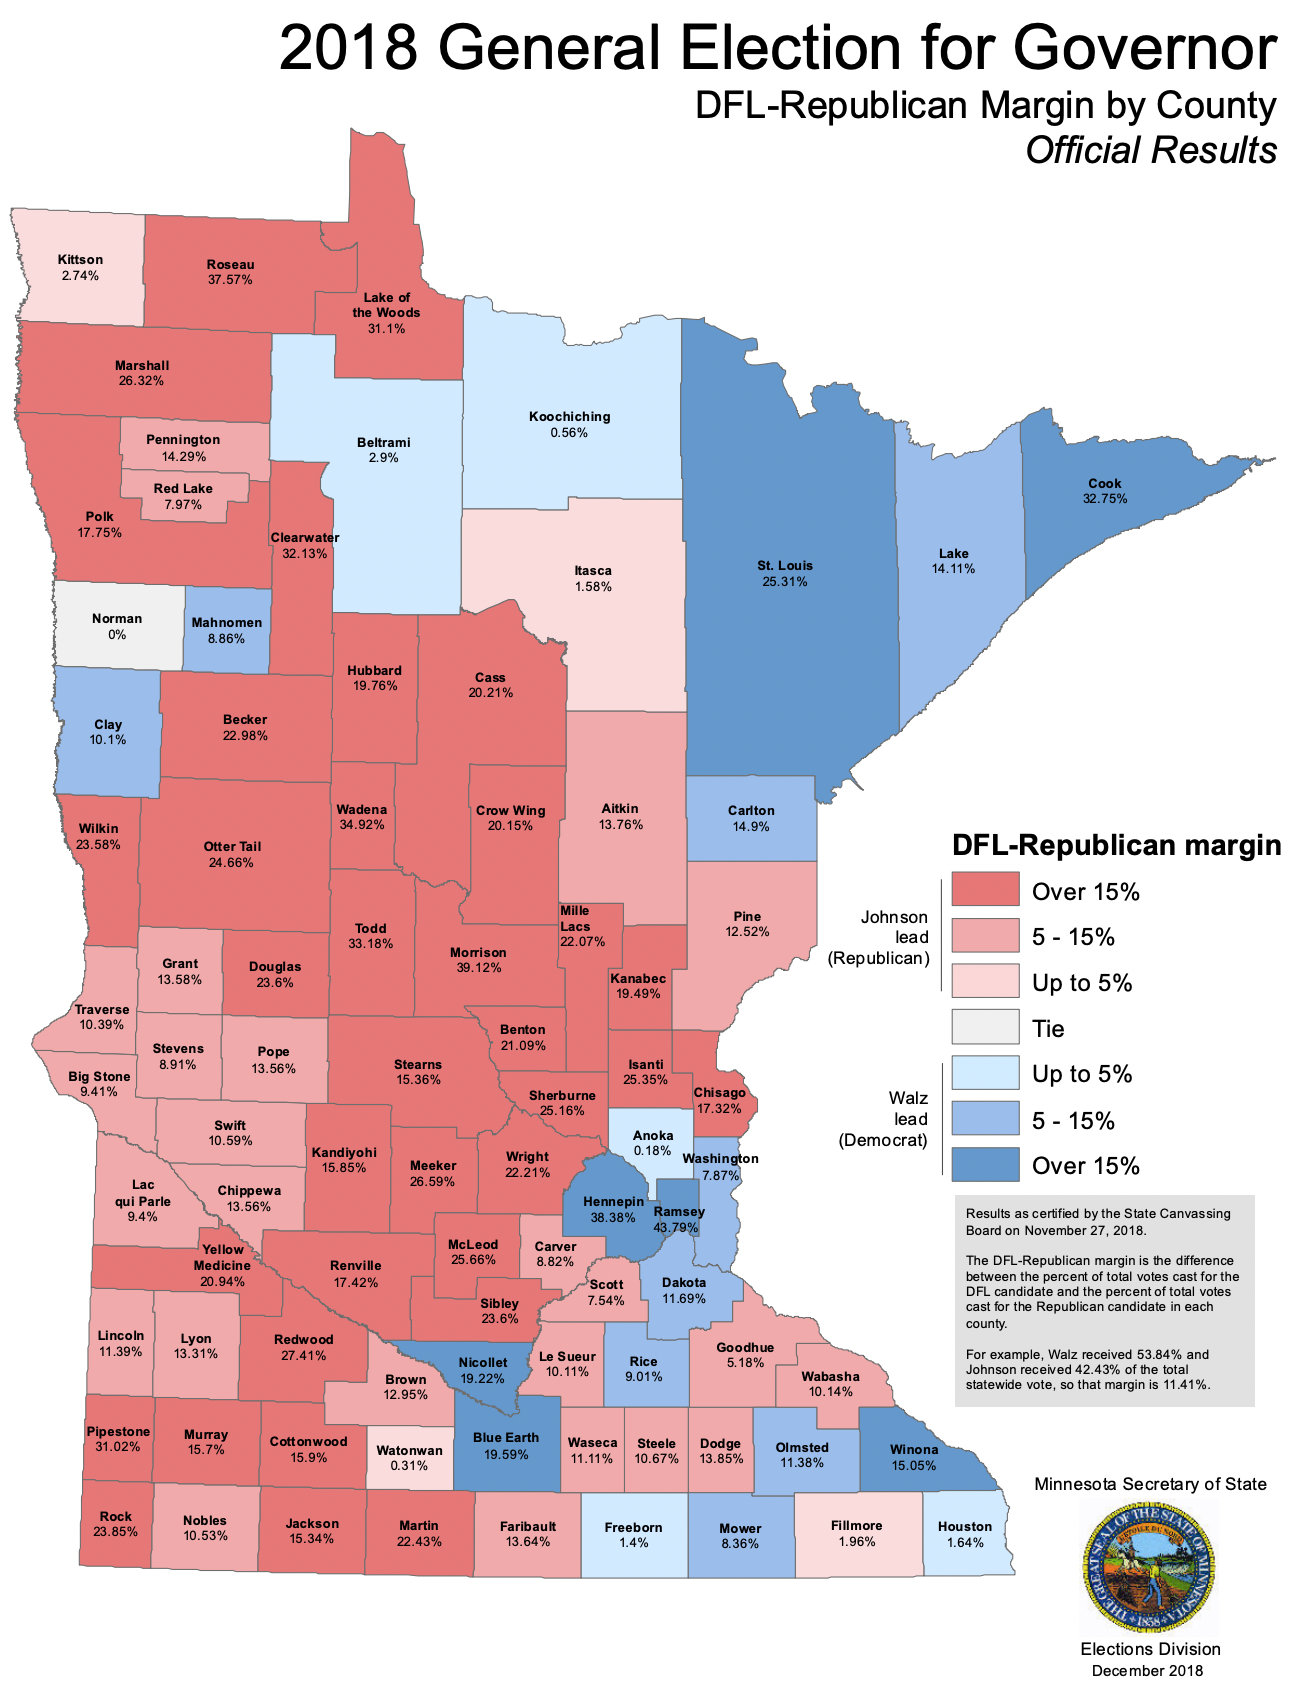
2018
- Republican Jeff Johnson: 1,097,705 (42.43 percent)
- Democrat Tim Walz: 1,393,096 (53.84 percent)
Note: In 2018, Dakota County was won by a Democratic governor after being a reliable Republican county.
2022
- Republican Scott Jensen: 1,119,911 (44.61 percent)
- Democrat Tim Walz: 1,312,311 (52.27 percent)

Get more local news delivered straight to your inbox. Sign up for free Patch newsletters and alerts.