Health & Fitness
Featured Roseville Blog: My Household's Carbon Footprint This Year: One Elephant
Roseville resident Chip Small learns how his patterns of consumption stack up with other Twin Cities residents--where we are all above average.

Groceries in. Garbage out.
This morning, as my kids eagerly awaited the weekly visit by the garbage truck, I had a chance to reflect on how much stuff that we consume.
Last year Earth’s population passed the 7 billion mark, a remarkable number given that it took tens of thousands of years to reach the 1 billion mark (around the year 1800) but only 12 years to go from 6 billion (in 1999) to 7 billion1.
Find out what's happening in Rosevillefor free with the latest updates from Patch.
But in terms of impact on the planet, not all humans are equal. Far from it, in fact. The world’s wealthiest half billion people (about 7 percent of the global population) are responsible for 50 percent of total human carbon dioxide emissions, while the poorest 50 percent contribute just seven percent of emissions2.
The United States, with around five percent of the world's population, accounts for a quarter of global fossil fuel consumption3. People in developed nations in North America, Western Europe, Japan, and Australia, consume resources like oil and metals and generate waste products like plastics and greenhouse gases at rates about 32 times greater than people living in the developing world4.
Find out what's happening in Rosevillefor free with the latest updates from Patch.
A group of researchers at the University of Minnesota predicted that this pattern of relatively few people consuming the most resources would be reflected at the level of individual households as well5.
Known as the Twin Cities Household Ecosystem Project6, this team quantified the amounts of the major elements carbon, nitrogen, and phosphorus, moving into and out of the households7 of hundreds of Twin Cities residents in Ramsey and Anoka Counties. These elements were chosen because carbon makes up important greenhouse gases (carbon dioxide and methane) driving global warming, and nitrogen and phosphorus are important nutrients that cause eutrophication in lakes and coastal waters.
These researchers used extensive surveys, which asked residents about homes, lawns, pets, diets, travel, and a number of other factors, to calculate the amount of resources used and waste produced to support each household. The amount of carbon, nitrogen, and phosphorus moving into and out of our households, known as fluxes, is an indicator of our consumption.
The team found that the distribution of fluxes was indeed skewed: 30 percent of the sampled households were responsible for 50 percent of the total fluxes—that is, a relatively small number of households used resources and produced waste at a disproportionately high rate. The sources of these fluxes were different for the different elements.
For carbon, driving and home energy were the dominant components. For nitrogen, lawn fertilizer and human diet were the most important variables. Our diets, our pets’ diets, and dishwashing detergent constituted the major phosphorus fluxes. Yet despite these different sources, fluxes of these elements were highly correlated. That is, households that use a lot of carbon are also likely to use a lot of nitrogen and phosphorus.
You can answer the same survey as the study participants8, and in 15 minutes, see how your household stacks up. I worked my way through the survey, fairly confident that we wouldn’t fall in that statistical tail of high consumers—but then I did fly a lot last year… so I could be in for a surprise.
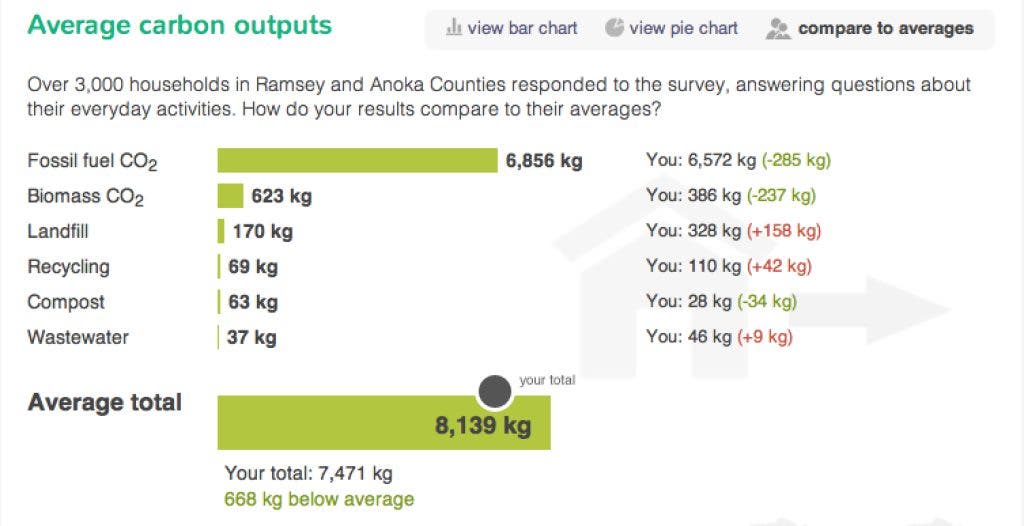
Turns out we’re about average. For carbon, we consumed a total of 7,471 kg (roughly the mass of an elephant!), slightly less than the average of 8,139 kg for Twin Cities households.
Nearly all of our carbon flux was due to combustion of fossil fuels—either in the vehicles we drive (or fly in) or in the power plants that produce our electricity. The extra carbon from my air travel last year was apparently offset by the fact that we don’t drive our cars all that much, and our house is small and relatively energy efficient.
The garbage and recycling that I carry to the curb each Friday morning, and the compost buckets that we dutifully empty in the backyard compost pile, combine for less than 2 percent of our carbon flux.
We also used a little less nitrogen (38.6 kg—roughly the mass of a medium-sized dog) compared the average household (48.2 kg). Here the major contributor was our diets (we eat meat—high in nitrogen—along with 88 percent of study participants) and also air travel, but I made up for these transgressions by not fertilizing my lawn.
Since the 2007 statewide law in Minnesota restricting phosphorus in lawn fertilizer, the major fluxes of this element come from our diets, our pets’ diets, and dishwashing detergents. We have no pets, but our family of four consumed a total of 1.73 kg of phosphorus in our diet.
The flux calculator correctly deduced that we wash a lot of dishes, accounting for another 2.4 kg. Our total phosphorus output of 5.09 kg (about the mass of a cat) put us over the Twin Cities household average of 4.08 kg.
We’re not one of those households out on the statistical tail. And in our defense, these fluxes are calculated at the household level, but divided by four, our per-capita fluxes come out a little better than those of the average two-person household.
But then, compared to an average family in China, India, or much of Africa, our consumption is exorbitant, no matter how you calculate it.
So, what to do with this information?
Much of these fluxes come with living in modern society. But, there are practical actions we can take that will reduce our fluxes: cut out a couple of flights each year, eat a little less meat, keep the thermostat turned down a couple of degrees lower in the winter.
The Household Flux Calculator website challenges us to try to cut our fluxes by 10 percent. Let’s give it a try.
Notes:
1 “7 Billion” January 2011 National Geographic.
4”What’s your consumption factor?” Jared Diamond, New York Times Op-Ed 1/2/2008
http://www.nytimes.com/2008/01/02/opinion/02diamond.html?pagewanted=all
5Fissore C, Baker LA, Hobbie SE, King JY, McFadden JP, Nelson KC, Jacobsdottir I. 2011. Carbon, nitrogen, and phosphorus fluxes in household ecosystems in the Minneapolis-Saint Paul, Minnesota, urban region. Ecological Applications 21: 619-639.
http://larrybakerlab.cfans.umn.edu/files/2011/07/Fissore2011EcolAppl.pdf
6Twin Cities Household Ecosystem Project: http://www.tchep.umn.edu/
7The researchers defined “household” to include all direct fluxes of carbon, nitrogen, and phosphorus associate with members of a household. So, the food that I order at a restaurant, and the fossil fuel consumed on a flight all count towards my carbon flux in this accounting scheme. However, the fossil fuel consumed to transport food and other materials from around the world to my house in Roseville are indirect fluxes, and are not considered here.