Politics & Government

Brentwood's Population Overtakes Maplewood in Latest Census

Some 2010 census data was made public on Thursday afternoon.

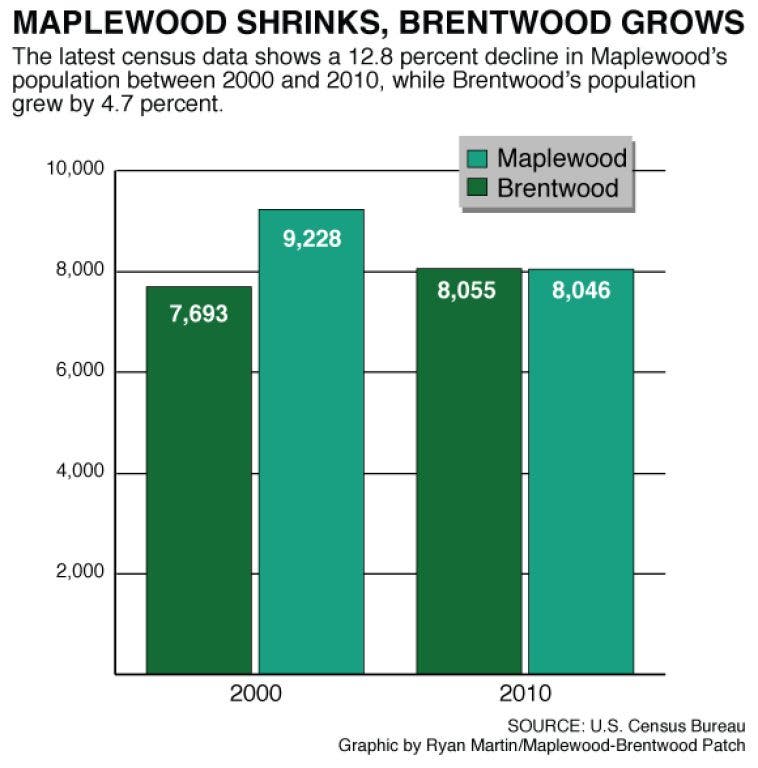
The latest U.S. Census data shows population numbers in Brentwood and Maplewood headed in different directions.

Maplewood's population declined by 1,182 people between 2000 and 2010, which amounts to a 12.8 percent drop in population. Brentwood headed the opposite way and grew by 4.7 percent or 362 people. Brentwood has a higher population now too—by 9 people.

Maplewood's loss of population follows a wider trend across St. Louis County, although the county's decline is less dramatic. The county's population dropped by 1.7 percent or 17,361 people.

Find out what's happening in Maplewood-Brentwoodfor free with the latest updates from Patch.

The latest census data was made available to the public on Thursday afternoon and is compiled below.

Population data from 2010 Census:

Find out what's happening in Maplewood-Brentwoodfor free with the latest updates from Patch.

  Brentwood  Maplewood  St. Louis County Missouri Total: 8,055 8,046 998,954 5,988,927   Population of one race: 7,901 7,767 980,358 5,864,338     White alone 7,047 5,966 701,948 4,958,770     Black or African American alone 250 1,384 233,029 693,391     American Indian and Alaska Native alone 8 20 1,962 27,376     Asian alone 547 279 34,597 98,083     Native Hawaiian and Other Pacific Islander alone 1 11 307 6,261     Some Other Race alone 48 107 8,515 80,457 Population of two or more races: 154 279 18,596 124,589   Hispanic or Latino (cultural designation, may be any race) 223 307 25,024 212,470 18 or older (voting age) 6,573 6,652 764,780 4,563,491


Population data from 2000 Census:

  Brentwood Maplewood St. Louis County Missouri Total: 7,693 9,228 1,016,315 5,595,211   Population of one race: 7,577 8,990 1,003,485 5,513,150     White alone 7,130 7,028 780,830 4,748,083     Black or African American alone 139 1,470 193,306 629,391     American Indian and Alaska Native alone 15 30 1,717 25,076     Asian alone 268 390 22,606 61,595     Native Hawaiian and Other Pacific Islander alone 0 6 251 3,178     Some other race alone 25 66 4,775 45,827   Population of two or more races: 116 238 12,830 82,061   Hispanic or Latino (cultural designation; may be any race) 133 205 14,577 118,592 18 or older (voting age) 6,214 7,540 760,324 4,167,519

Get more local news delivered straight to your inbox. Sign up for free Patch newsletters and alerts.

More from Maplewood-Brentwood