Schools
These 190-Plus Districts May Face Tax Hike: NJ School Aid Figures
The losing school districts – more than 190 of them – may be forced to raise taxes to make up for losses in school funding.


Looks like the days of getting little help from New Jersey – and possibly raising taxes to make up for the budget shortfall – will continue for more than 190 school districts this year.
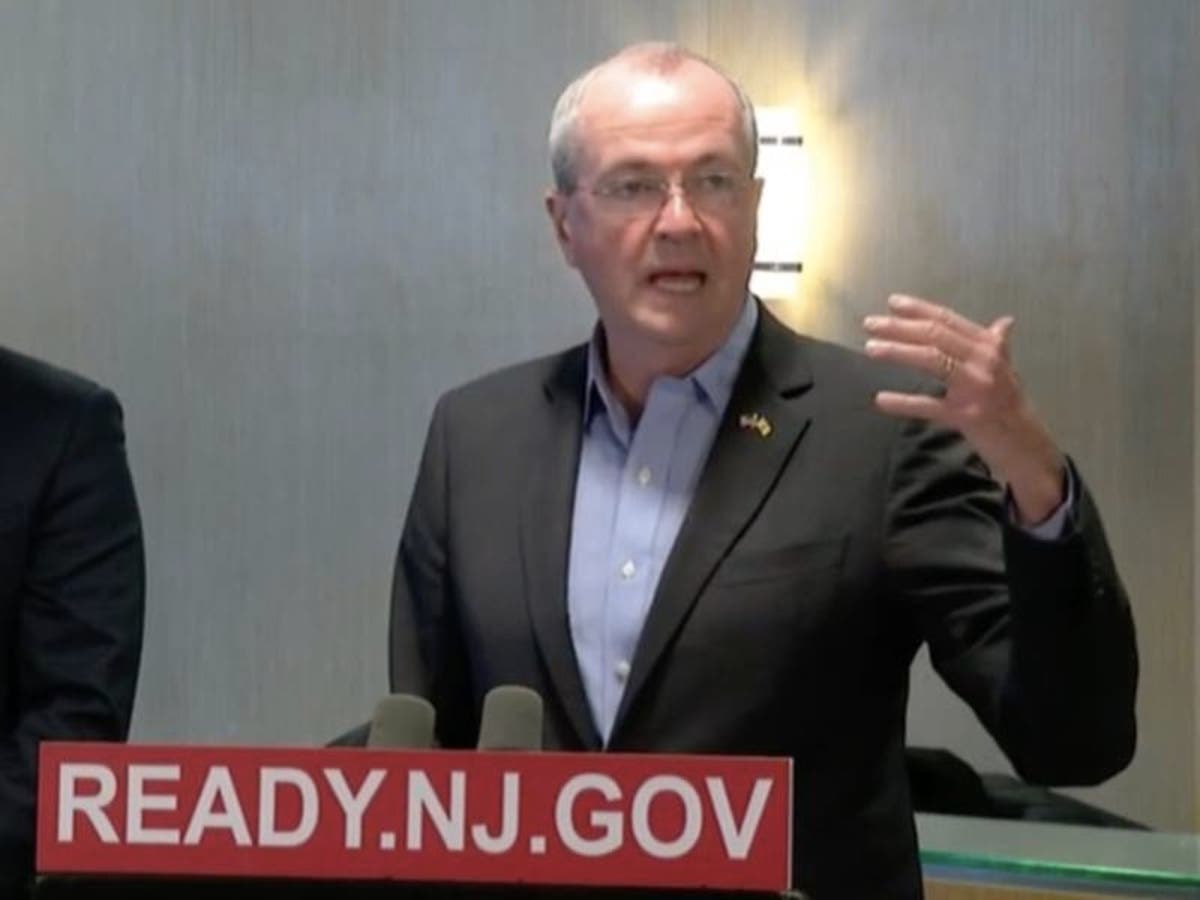
Gov. Phil Murphy's administration this week released the proposed state aid numbers for every school district in the 2019-20 school year. Indeed, 197 school districts would have a decrease under his school funding plan, and they may need tax increases to make up the differences (see complete list below).
Overall, state aid would increase 2.43 over the 2018-19 school year under a plan that requires approval from the state Legislature. That number would be smaller than the 3.5 percent increase Murphy originally proposed last year, but that original plan had no state aid cuts for any district.
Find out what's happening in Chathamfor free with the latest updates from Patch.
Read more: 6 Points In NJ Gov. Phil Murphy's Budget Address That Affect You
Murphy was ultimately forced to revise his agenda and put forward a plan that cut aid to 171 districts in the 2018-19. Senate President Steve Sweeney got the upper hand in his push to fully fund a number of districts that had been promised more money for years.
Find out what's happening in Chathamfor free with the latest updates from Patch.
A number of districts protested the changes, and many of them even appeared at the State House this week, just as Murphy was giving his budget address, to voice their displeasure. Read more: Toms River Sends 27 Buses To Support Our Students Rally
State aid weighs heavily in many district's decisions on raising local property taxes. Many often say that aid cuts or flat spending from year to year gives them cause to raise what are already the highest property taxes.
Some districts saw double-digit increases, including Lakewood (63.66 percent), Atlantic City (39.23 percent) and Woodbridge (21.78 percent). The biggest losers happened to be in areas where Murphy may not be so popular, such Hunterdon and Monmouth counties.
Murphy said the state aid figures show his administration has "made a commitment to education, and that is reflected in the historic levels of state aid to schools in our proposed spending plan.”
Murphy said his proposed budget will increase direct K-12 school aid, or “formula aid,” by $206 million.
“When you make that kind of commitment to education, you see the results," he said.
A number of local officials voiced support for the state aid proposal. Mayor Michael Soriano of Parsippany Troy-Hills said the budget "continues to take a proactive and studied approach towards the goal of a school funding formula that is fair to every municipality, district, parent, teacher and student in our state."
"I want to thank him (Murphy) for his courage on this issue; tackling a decades-long problem is never easy, but these first steps continue our state’s movement towards equality,” he said.
Some districts, however, were already protesting the numbers. Superinendent Charles Sampson of the Freehold Regional High School district, whose district is losing $3.78 million, a 7.52 decline, called the process "flawed."
"Formula deeply flawed, not transparent an artificially inflated," he tweeted. "Gutting one of most efficient models in New Jersey."
Senator Jim Holzapfel and Assemblymen Dave Wolfe and Greg McGuckin blasted the new cuts to local school aid, calling his proposal “severely flawed.” They expressed serious concern that property taxes will be forced higher as schools districts attempt to preserve the quality of education in their classrooms.
“Fair funding for all students in New Jersey is lost on Governor Murphy and his administration,” said Holzapfel. “Continuing this pattern of cuts year after year creates a ripple effect in the community, which impacts everyone from the student to the taxpayer. This is not a fair funding formula, in fact, it is severely flawed and these political games stand to hurt our children the most.”
According to the recently released State aid numbers, school districts within the 10th Legislative District will lose over $5.5 million in state aid next. The biggest cuts will come at the expense of the Brick and Toms River school districts, which will lose more than $2.7 million each, they said.
“We just want our school districts, the students they serve, and our local taxpayers to be treated fairly,” added Wolfe. “Brick and Toms River have been fiscally responsible, spending less than the state average to deliver a quality education."
Below is the complete list of school districts, ranked based on their decreases and increases in aid (and tax hike possibility, from top to bottom).
The first number is the percentage decrease or increase in aid; the second is the amount of aid; the third is the loss or gain in aid dollars:
- Frenchtown Boro, Hunterdon -23.29% $583,436 -$177,147
- Roosevelt Boro, Monmouth -15.16% $831,022 -$148,459
- Califon Boro, Hunterdon -14.04% $268,192 -$43,800
- Washington Twp, Burlington -12.97% $532,809 -$79,439
- Estell Manor City, Atlantic -10.37% $1,937,980 -$224,280
- Dennis Twp, Cape May -10.29% $5,207,843 -$597,414
- Hopatcong, Sussex -10.18% $9,636,888 -$1,092,000
- Ocean Twp, Ocean -10.15% $5,871,831 -$663,015
- Stillwater Twp, Sussex -10.15% $1,544,769 -$174,593
- Weymouth Twp, Atlantic -9.93% $2,022,909 -$222,953
- Springfield Twp, Burlington -9.74% $1,031,410 -$111,324
- Lower Twp, Cape May -9.57% $8,946,952 -$947,285
- Logan Twp, Gloucester -9.48% $4,720,833 -$494,633
- Great Meadows Regional, Warren -9.46% $5,150,660 -$538,066
- Byram Twp, Sussex -9.43% $3,440,894 -$358,049
- Lebanon Twp, Hunterdon -9.36% $2,080,046 -$214,844
- Hampton Boro, Hunterdon -9.34% $831,712 -$85,671
- Delaware Valley Regional, Hunterdon -9.18% $3,504,168 -$354,248
- Neptune City, Monmouth -9.01% $1,827,344 -$180,852
- Cape May Point, Cape May -8.99% $23,194 -$2,290
- Hope Twp, Warren -8.82% $854,934 -$82,685
- Beach Haven Boro, Ocean -8.80% $215,772 -$20,816
- Kittatinny Regional, Sussex -8.58% $5,370,219 -$504,273
- Blairstown Twp, Warren -8.56% $1,746,486 -$163,446
- Knowlton Twp, Warren -8.49% $1,229,205 -$113,982
- Wenonah Boro, Gloucester -8.47% $442,117 -$40,897
- White Twp, Warren -8.41% $1,515,804 -$139,150
- Milford Boro, Hunterdon -8.40% $302,273 -$27,724
- Allenhurst, Monmouth -8.38% $41,557 -$3,802
- Washington Twp, Warren -8.37% $2,306,815 -$210,670
- Franklin Twp, Warren -8.34% $664,197 -$60,455
- Bethlehem Twp, Hunterdon -8.34% $1,380,559 -$125,629
- Lower Cape May Regional, Cape May -8.26% $8,741,581 -$787,031
- Lower Alloways Creek, Salem -8.24% $769,490 -$69,062
- Manalapan-Englishtown Reg, Monmouth -8.20% $17,234,564 -$1,538,750
- Frankford Twp, Sussex -8.15% $1,735,486 -$153,940
- Frelinghuysen Twp, Warren -8.09% $537,768 -$47,354
- Hampton Twp, Sussex -8.06% $1,112,747 -$97,508
- Brick Twp, Ocean -8.03% $31,400,703 -$2,741,894
- Mannington Twp, Salem -8.03% $490,432 -$42,791
- Eatontown Boro, Monmouth -7.84% $3,361,196 -$286,040
- High Point Regional, Sussex -7.80% $5,658,765 -$478,657
- Jefferson Twp, Morris -7.69% $14,315,347 -$1,193,302
- Holland Twp, Hunterdon -7.68% $1,675,310 -$139,422
- North Wildwood City, Cape May -7.65% $588,442 -$48,751
- Lake Como, Monmouth -7.61% $519,929 -$42,827
- Highlands Boro, Monmouth -7.54% $563,324 -$45,935
- Washington Twp, Morris -7.53% $7,219,390 -$587,683
- Freehold Regional, Monmouth -7.52% $46,515,390 -$3,780,766
- Seaside Park Boro, Ocean -7.43% $139,844 -$11,223
- Lakeland Regional, Passaic -7.34% $4,346,660 -$344,052
- North Warren Regional, Warren -7.29% $4,435,542 -$348,898
- Kingwood Twp, Hunterdon -7.28% $1,180,414 -$92,724
- Plumsted Twp, Ocean -7.07% $10,581,143 -$804,862
- Evesham Twp, Burlington -7.07% $12,163,632 -$924,838
- West Milford Twp, Passaic -6.69% $13,245,693 -$950,066
- Jersey City, Hudson -6.68% $379,711,659 -$27,192,633
- Fredon Twp, Sussex -6.64% $485,559 -$34,550
- Andover Reg, Sussex -6.58% $2,109,938 -$148,575
- Wanaque Boro, Passaic -6.57% $2,268,631 -$159,578
- Brigantine City, Atlantic -6.50% $2,052,562 -$142,674
- Downe Twp, Cumberland -6.49% $1,672,383 -$116,116
- Asbury Park City, Monmouth -6.45% $49,739,416 -$3,426,828
- Hainesport Twp, Burlington -6.41% $1,246,317 -$85,348
- Sandyston-Walpack Twp, Sussex -6.36% $525,290 -$35,656
- Hardyston Twp, Sussex -6.22% $1,973,894 -$130,927
- Sussex-Wantage Regional, Sussex -6.18% $7,021,638 -$462,378
- Upper Twp, Cape May -6.14% $9,214,603 -$602,522
- Bradley Beach Boro, Monmouth -6.12% $959,328 -$62,531
- Randolph Twp, Morris -6.09% $11,722,616 -$760,404
- Vernon Twp, Sussex -6.09% $22,641,091 -$1,467,098
- Cape May City, Cape May -6.03% $515,341 -$33,045
- Tabernacle Twp, Burlington -5.98% $4,916,549 -$312,893
- Monmouth Regional, Monmouth -5.98% $3,013,601 -$191,489
- Delaware Twp, Hunterdon -5.95% $1,062,634 -$67,276
- Hamburg Boro, Sussex -5.79% $1,471,190 -$90,398
- Roxbury Twp, Morris -5.73% $12,935,286 -$786,714
- Point Pleasant Boro, Ocean -5.63% $5,485,987 -$327,367
- Lafayette Twp, Sussex -5.63% $787,554 -$46,973
- Linwood City, Atlantic -5.52% $1,422,843 -$83,056
- Bloomingdale Boro, Passaic -5.50% $1,828,119 -$106,413
- Southampton Twp, Burlington -5.41% $1,929,551 -$110,346
- Alexandria Twp, Hunterdon -5.35% $1,402,343 -$79,321
- Ringwood Boro, Passaic -5.32% $2,646,264 -$148,595
- Upper Pittsgrove Twp, Salem -5.27% $3,287,501 -$182,796
- Clinton Town, Hunterdon -5.19% $1,238,729 -$67,850
- Neptune Twp, Monmouth -5.19% $29,849,956 -$1,634,653
- Corbin City, Atlantic -5.08% $638,000 -$34,175
- Englewood City, Bergen -5.07% $9,152,738 -$488,944
- Howell Twp, Monmouth -5.04% $30,981,099 -$1,645,527
- Millstone Twp, Monmouth -5.03% $4,459,115 -$236,100
- Lumberton Twp, Burlington -5.00% $7,635,482 -$401,790
- Marlboro Twp, Monmouth -5.00% $10,603,783 -$557,965
- Eagleswood Twp, Ocean -4.99% $645,895 -$33,926
- Sea Isle City, Cape May -4.91% $233,279 -$12,050
- Stanhope Boro, Sussex -4.83% $1,393,431 -$70,753
- Jackson Twp, Ocean -4.71% $46,473,068 -$2,297,004
- South Brunswick Twp, Middlesex -4.63% $23,683,662 -$1,150,181
- Wildwood City, Cape May -4.62% $4,763,067 -$230,590
- Stow Creek Twp, Cumberland -4.61% $763,534 -$36,930
- West Cape May Boro, Cape May -4.60% $617,700 -$29,803
- Woodland Twp, Burlington -4.58% $859,032 -$41,206
- Hoboken City, Hudson -4.53% $9,490,928 -$450,418
- Avalon Boro, Cape May -4.47% $69,776 -$3,265
- Old Bridge Twp, Middlesex -4.44% $42,209,527 -$1,961,039
- Wildwood Crest Boro, Cape May -4.38% $663,273 -$30,348
- Toms River Regional, Ocean -4.21% $63,203,786 -$2,780,498
- Ogdensburg Boro, Sussex -4.18% $2,121,831 -$92,447
- Weehawken Twp, Hudson -4.16% $2,498,982 -$108,387
- Ventnor City, Atlantic -4.14% $1,943,800 -$83,958
- Deal Boro, Monmouth -4.09% $2,146,983 -$91,616
- Union Beach, Monmouth -4.08% $7,812,127 -$332,434
- Riverton, Burlington -4.07% $519,770 -$22,058
- Wallkill Valley Regional, Sussex -3.96% $4,350,189 -$179,218
- Stafford Twp, Ocean -3.91% $9,065,632 -$368,984
- Shamong Twp, Burlington -3.90% $4,030,793 -$163,531
- Montague Twp, Sussex -3.85% $2,491,509 -$99,620
- Ocean Twp, Monmouth -3.84% $7,185,825 -$286,967
- Henry Hudson Regional, Monmouth -3.82% $738,590 -$29,308
- Greenwich Twp, Warren -3.78% $5,720,965 -$224,803
- Flemington-Raritan Reg, Hunterdon -3.73% $5,821,687 -$225,571
- N Hunt/Voorhees Regional, Hunterdon -3.68% $5,254,962 -$200,892
- Hazlet Twp, Monmouth -3.67% $12,089,591 -$460,782
- Greenwich Twp, Gloucester -3.62% $1,050,305 -$39,497
- Tinton Falls, Monmouth -3.47% $3,339,370 -$120,172
- Voorhees Twp, Camden -3.47% $5,265,788 -$189,295
- Bass River Twp, Burlington -3.44% $827,153 -$29,467
- Lenape Regional, Burlington -3.40% $27,338,536 -$961,300
- Chesilhurst, Camden -3.33% $2,339,668 -$80,562
- Pemberton Twp, Burlington -3.32% $78,092,473 -$2,685,232
- Greenwich Twp, Cumberland -3.29% $400,868 -$13,639
- Mine Hill Twp, Morris -3.25% $2,931,613 -$98,350
- Middletown Twp, Monmouth -3.22% $16,614,673 -$552,572
- Tuckerton Boro, Ocean -3.11% $2,180,353 -$70,063
- Washington Twp, Gloucester -2.99% $47,174,817 -$1,454,975
- Upper Freehold Regional, Monmouth -2.99% $5,670,128 -$174,578
- Middle Twp, Cape May -2.99% $12,769,635 -$393,097
- Lacey Twp, Ocean -2.97% $20,347,244 -$623,156
- Stone Harbor Boro, Cape May -2.97% $50,786 -$1,555
- Hunterdon Central Reg, Hunterdon -2.89% $5,517,017 -$163,973
- New Hanover Twp, Burlington -2.77% $2,363,427 -$67,363
- Belmar Boro, Monmouth -2.69% $938,579 -$25,894
- Medford Twp, Burlington -2.39% $4,587,473 -$112,348
- Woodbury Heights Boro, Gloucester -2.36% $965,407 -$23,362
- Lopatcong Twp, Warren -2.28% $3,563,243 -$83,167
- Longport, Atlantic -2.24% $87,130 -$2,000
- Pitman Boro, Gloucester -2.23% $9,371,934 -$213,981
- Alloway Twp, Salem -2.16% $3,573,890 -$79,044
- Clearview Regional, Gloucester -2.12% $14,590,990 -$315,939
- Hillsborough Twp, Somerset -2.11% $24,399,824 -$526,434
- Lenape Valley Regional, Sussex -2.10% $4,827,174 -$103,731
- West Wildwood, Cape May -2.04% $42,053 -$875
- South Plainfield Boro, Middlesex -1.95% $9,103,277 -$180,963
- Sparta Twp, Sussex -1.77% $5,795,317 -$104,617
- Waterford Twp, Camden -1.74% $12,380,611 -$219,296
- Long Beach Island, Ocean -1.55% $774,965 -$12,215
- Little Egg Harbor Twp, Ocean -1.53% $9,252,030 -$143,520
- Ocean City, Cape May -1.51% $3,889,893 -$59,509
- Lavallette Boro, Ocean -1.48% $169,957 -$2,553
- Keansburg Boro, Monmouth -1.46% $26,150,418 -$388,198
- High Bridge Boro, Hunterdon -1.43% $1,416,733 -$20,588
- Mantua Twp, Gloucester -1.39% $6,050,956 -$85,125
- Eastern Camden County Reg, Camden -1.36% $9,099,650 -$125,304
- Leonia Boro, Bergen -1.28% $3,502,863 -$45,273
- Harrison Twp, Gloucester -1.27% $6,017,974 -$77,318
- Gibbsboro Boro, Camden -1.25% $1,351,621 -$17,042
- Island Heights Boro, Ocean -1.24% $295,372 -$3,708
- Port Republic City, Atlantic -1.18% $1,059,903 -$12,644
- Clinton Twp, Hunterdon -1.17% $1,996,974 -$23,673
- West Morris Regional, Morris -1.15% $4,279,148 -$49,648
- Cumberland Regional, Cumberland -1.09% $12,750,815 -$140,427
- Lebanon Boro, Hunterdon -1.04% $199,554 -$2,097
- Buena Regional, Atlantic -1.03% $19,136,836 -$199,259
- Morris School District, Morris -0.98% $7,157,227 -$70,795
- Delsea Regional H.S Dist., Gloucester -0.96% $13,881,263 -$135,163
- Eastampton Twp, Burlington -0.90% $4,503,339 -$40,718
- Margate City, Atlantic -0.85% $531,278 -$4,570
- Oaklyn Boro, Camden -0.82% $2,518,473 -$20,866
- Kenilworth Boro, Union -0.77% $6,324,971 -$48,875
- Manchester Twp, Ocean -0.60% $5,374,263 -$32,569
- Berlin Twp, Camden -0.57% $5,862,162 -$33,653
- Winfield Twp, Union -0.57% $1,797,491 -$10,308
- Maurice River Twp, Cumberland -0.54% $4,828,658 -$25,994
- Matawan-Aberdeen Regional, Monmouth -0.49% $12,644,179 -$62,467
- Warren Hills Regional, Warren -0.46% $10,756,907 -$49,182
- Somers Point City, Atlantic -0.45% $5,790,495 -$26,302
- Alpha Boro, Warren -0.43% $1,951,390 -$8,388
- Pohatcong Twp, Warren -0.36% $1,808,192 -$6,454
- Pinelands Regional, Ocean -0.31% $11,093,513 -$34,573
- Elk Twp, Gloucester -0.29% $2,543,621 -$7,428
- Haddon Heights Boro, Camden -0.27% $1,716,752 -$4,638
- Ocean Gate Boro, Ocean -0.26% $951,425 -$2,438
- Willingboro Twp, Burlington -0.23% $38,813,573 -$88,938
- East Amwell Twp, Hunterdon -0.22% $874,234 -$1,896
- Woodbine Boro, Cape May -0.21% $2,923,291 -$6,279
- Rancocas Valley Regional, Burlington -0.07% $16,281,037 -$12,062
- Mainland Regional, Atlantic -0.01% $7,900,510 -$434
- Mullica Twp, Atlantic 0.00% $5,481,097 $0
- Bergen County Vocational, Bergen 0.00% $5,695,547 $0
- Cape May Co Vocational, Cape May 0.00% $1,396,049 $0
- Fairfield Twp, Cumberland 0.00% $6,106,657 $0
- East Orange, Essex 0.00% $175,087,372 $0
- Hunterdon Co Vocational, Hunterdon 0.00% $933,283 $0
- South Amboy City, Middlesex 0.00% $6,627,860 $0
- Monmouth Co Vocational, Monmouth 0.00% $8,120,555 $0
- Lakehurst Boro, Ocean 0.00% $5,974,209 $0
- Ocean County Vocational, Ocean 0.00% $5,585,095 $0
- Somerset Co Vocational, Somerset 0.00% $1,428,562 $0
- Sussex County Vocational, Sussex 0.00% $4,197,167 $0
- Vineland City, Cumberland 0.01% $134,760,972 $14,814
- Farmingdale Boro, Monmouth 0.05% $805,840 $370
- Lawrence Twp, Cumberland 0.06% $6,304,442 $4,070
- Burlington City, Burlington 0.11% $16,752,937 $18,309
- North Hanover Twp, Burlington 0.12% $11,817,391 $13,841
- Haddon Twp, Camden 0.12% $8,208,724 $9,848
- Keyport Boro, Monmouth 0.15% $5,759,852 $8,354
- Mansfield Twp, Burlington 0.16% $666,747 $1,042
- South-Hunterdon, Hunterdon 0.22% $2,372,466 $5,263
- Mount Ephraim Boro, Camden 0.29% $4,157,294 $12,068
- Central Regional, Ocean 0.30% $4,269,759 $12,972
- Lincoln Park Boro, Morris 0.36% $1,708,763 $6,157
- Harrison Town, Hudson 0.41% $26,284,533 $107,842
- Union Twp, Hunterdon 0.44% $642,799 $2,833
- Barnegat Twp, Ocean 0.47% $20,535,935 $95,125
- Franklin Twp, Somerset 0.47% $14,031,573 $65,234
- Collingswood Boro, Camden 0.49% $10,535,989 $51,145
- Glassboro, Gloucester 0.53% $14,832,606 $78,279
- Millville City, Cumberland 0.54% $67,557,680 $360,640
- Mansfield Twp, Warren 0.55% $3,754,969 $20,428
- Burlington Co Vocational, Burlington 0.55% $14,738,120 $81,134
- Morris Hills Regional, Morris 0.56% $8,146,360 $45,386
- Quinton Twp, Salem 0.58% $3,550,445 $20,404
- Franklin Boro, Sussex 0.63% $3,276,002 $20,540
- Hopewell Twp, Cumberland 0.66% $3,488,970 $23,028
- Hamilton Twp, Mercer 0.77% $74,684,341 $568,960
- Winslow Twp, Camden 0.80% $44,266,082 $352,840
- Camden City, Camden 0.83% $284,372,949 $2,343,632
- Woodstown-Pilesgrove Reg, Salem 0.87% $7,128,473 $61,187
- Pleasantville City, Atlantic 0.91% $64,631,580 $582,779
- Morris County Vocational, Morris 0.93% $1,244,509 $11,444
- Warren County Vocational, Warren 0.96% $3,338,826 $31,820
- Delanco Twp, Burlington 0.96% $2,521,311 $24,079
- Florence Twp, Burlington 0.97% $9,863,569 $94,354
- Green Twp, Sussex 1.00% $2,655,854 $26,240
- Dumont Boro, Bergen 1.01% $8,964,090 $89,782
- Union Twp, Union 1.02% $33,018,480 $334,220
- Barrington Boro, Camden 1.03% $3,462,725 $35,435
- Deerfield Twp, Cumberland 1.05% $2,656,855 $27,508
- Interlaken, Monmouth 1.07% $65,815 $698
- Gloucester City, Camden 1.09% $29,918,604 $323,067
- Belvidere Town, Warren 1.10% $2,950,456 $32,086
- Gloucester Twp, Camden 1.10% $52,489,695 $572,024
- Palmyra Boro, Burlington 1.12% $5,103,911 $56,320
- Franklin Twp, Gloucester 1.13% $9,379,125 $104,761
- Point Pleasant Beach, Ocean 1.14% $590,412 $6,664
- Harmony Twp, Warren 1.17% $411,957 $4,762
- Pequannock Twp, Morris 1.18% $2,295,358 $26,862
- Black Horse Pike Regional, Camden 1.20% $34,533,999 $410,440
- Freehold Twp, Monmouth 1.34% $4,588,407 $60,602
- Rutherford Boro, Bergen 1.35% $2,703,931 $35,904
- Greater Egg Harbor Reg, Atlantic 1.35% $32,571,829 $434,276
- Audubon Boro, Camden 1.39% $8,926,842 $122,165
- Elsinboro Twp, Salem 1.41% $1,078,801 $14,953
- South Harrison Twp, Gloucester 1.45% $1,717,537 $24,609
- South Bound Brook, Somerset 1.47% $3,681,063 $53,383
- Brooklawn Boro, Camden 1.53% $4,493,197 $67,792
- Rockaway Twp, Morris 1.56% $3,051,591 $46,792
- Pittsgrove Twp, Salem 1.56% $16,089,015 $247,702
- Phillipsburg Town, Warren 1.57% $38,649,942 $596,711
- North Bergen Twp, Hudson 1.60% $62,220,610 $981,427
- Hudson County Vocational, Hudson 1.60% $22,716,751 $358,635
- Garfield City, Bergen 1.63% $59,824,322 $957,481
- Commercial Twp, Cumberland 1.67% $9,466,683 $155,778
- Seaside Heights Boro, Ocean 1.73% $1,067,765 $18,188
- Tewksbury Twp, Hunterdon 1.80% $950,799 $16,808
- Palisades Park, Bergen 1.82% $2,032,299 $36,376
- Camden County Vocational, Camden 1.85% $24,044,993 $436,821
- Salem City, Salem 1.88% $16,992,760 $314,029
- Oldmans Twp, Salem 1.88% $2,138,614 $39,553
- Gateway Regional, Gloucester 1.92% $8,158,454 $153,716
- Magnolia Boro, Camden 1.93% $3,271,926 $61,862
- Oxford Twp, Warren 1.95% $2,773,505 $52,909
- West Deptford Twp, Gloucester 1.97% $13,207,682 $255,636
- Spotswood, Middlesex 1.98% $6,723,524 $130,736
- Avon Boro, Monmouth 2.02% $199,294 $3,945
- Berlin Boro, Camden 2.02% $3,990,939 $79,007
- Hamilton Twp, Atlantic 2.14% $24,858,638 $521,448
- Passaic City, Passaic 2.16% $245,881,887 $5,191,735
- Sea Girt Boro, Monmouth 2.17% $131,992 $2,799
- Irvington Township, Essex 2.35% $120,460,413 $2,769,060
- Montclair Town, Essex 2.38% $7,605,632 $177,106
- Ridgefield Boro, Bergen 2.40% $2,663,682 $62,392
- Total, 2.43% $8,691,933,675 $205,968,212
- Teaneck Twp, Bergen 2.44% $6,135,179 $145,902
- Bay Head Boro, Ocean 2.51% $74,737 $1,827
- Upper Deerfield Twp, Cumberland 2.56% $6,974,600 $173,895
- Bloomsbury Boro, Hunterdon 2.56% $867,550 $21,689
- Deptford Twp, Gloucester 2.61% $26,179,831 $666,359
- Union City, Hudson 2.61% $195,158,400 $4,969,701
- Middlesex Co Vocational, Middlesex 2.65% $14,572,846 $375,823
- Spring Lake Boro, Monmouth 2.67% $239,543 $6,219
- Perth Amboy City, Middlesex 2.69% $172,615,671 $4,514,814
- Mount Holly Twp, Burlington 2.79% $10,582,214 $286,852
- Northfield City, Atlantic 2.85% $4,191,339 $116,004
- West New York Town, Hudson 2.85% $103,236,768 $2,864,990
- Maywood Boro, Bergen 2.90% $1,297,459 $36,610
- Rockaway Boro, Morris 2.95% $1,294,134 $37,133
- Galloway Twp, Atlantic 3.05% $25,360,351 $751,277
- National Park Boro, Gloucester 3.07% $2,216,567 $65,917
- Paterson City, Passaic 3.11% $439,251,959 $13,238,364
- Newark City, Essex 3.15% $812,391,624 $24,767,712
- Hawthorne Boro, Passaic 3.16% $3,132,038 $95,888
- Pennsauken Twp, Camden 3.19% $53,457,593 $1,653,976
- City Of Orange Twp, Essex 3.20% $81,122,049 $2,517,095
- Princeton, Mercer 3.24% $4,153,532 $130,329
- Mount Arlington Boro, Morris 3.24% $635,321 $19,956
- Beverly City, Burlington 3.35% $3,783,055 $122,723
- Westampton, Burlington 3.41% $4,072,209 $134,379
- Red Bank Regional, Monmouth 3.53% $1,213,735 $41,372
- Trenton City, Mercer 3.54% $250,805,450 $8,578,701
- Penns Grv-Carney's Pt Reg, Salem 3.68% $23,834,809 $844,897
- Northern Burlington Reg, Burlington 3.69% $13,890,223 $494,514
- Pine Hill Boro, Camden 3.71% $18,326,926 $654,776
- Monmouth Beach Boro, Monmouth 3.73% $187,166 $6,733
- Long Branch City, Monmouth 3.78% $47,098,753 $1,713,305
- Mount Laurel Twp, Burlington 3.83% $5,021,933 $185,353
- Garwood Boro, Union 3.87% $523,974 $19,529
- Elizabeth City, Union 3.88% $405,669,746 $15,136,244
- Folsom Boro, Atlantic 3.88% $6,096,776 $227,644
- Wall Twp, Monmouth 3.89% $4,187,745 $156,806
- Bridgewater-Raritan Reg, Somerset 3.94% $10,431,111 $395,158
- East Newark Boro, Hudson 4.00% $3,908,179 $150,392
- Clementon Boro, Camden 4.02% $6,634,992 $256,331
- Cinnaminson Twp, Burlington 4.03% $9,672,564 $374,948
- Manasquan Boro, Monmouth 4.05% $750,415 $29,191
- Lawnside Boro, Camden 4.11% $4,250,262 $167,604
- Colts Neck Twp, Monmouth 4.13% $1,183,020 $46,950
- Butler Boro, Morris 4.33% $2,201,800 $91,380
- Berkeley Twp, Ocean 4.39% $2,673,332 $112,522
- Somerdale Boro, Camden 4.42% $3,375,879 $142,861
- New Brunswick City, Middlesex 4.47% $139,173,998 $5,957,300
- Burlington Twp, Burlington 4.62% $20,944,487 $924,333
- Spring Lake Heights Boro, Monmouth 4.62% $387,430 $17,112
- Highland Park Boro, Middlesex 4.68% $4,168,916 $186,341
- Essex Co Voc-Tech, Essex 4.81% $23,214,571 $1,064,999
- Hillsdale Boro, Bergen 4.86% $981,998 $45,484
- Runnemede Boro, Camden 4.88% $5,508,938 $256,086
- Chester Twp, Morris 4.89% $1,252,166 $58,402
- Woodbury City, Gloucester 4.95% $13,707,930 $646,377
- Monroe Twp, Gloucester 5.01% $39,408,328 $1,880,724
- Paulsboro Boro, Gloucester 5.09% $13,733,494 $665,236
- Morris Plains Boro, Morris 5.10% $881,429 $42,795
- Sterling High School Dist, Camden 5.12% $7,976,839 $388,388
- Washington Boro, Warren 5.20% $3,068,199 $151,782
- Moonachie Boro, Bergen 5.26% $483,518 $24,167
- Nutley Town, Essex 5.26% $7,999,442 $399,990
- Newfield Boro, Gloucester 5.28% $1,583,929 $79,487
- Bridgeton City, Cumberland 5.29% $91,402,680 $4,590,125
- Woodlynne Boro, Camden 5.37% $7,862,686 $400,787
- Midland Park Boro, Bergen 5.40% $782,688 $40,124
- Piscataway Twp, Middlesex 5.43% $20,637,562 $1,063,533
- Moorestown Twp, Burlington 5.50% $3,772,135 $196,768
- Laurel Springs Boro, Camden 5.54% $2,217,194 $116,401
- East Brunswick Twp, Middlesex 5.61% $19,813,778 $1,052,081
- Gloucester Co Vocational, Gloucester 5.63% $8,851,810 $472,129
- Lyndhurst Twp, Bergen 5.66% $2,328,322 $124,774
- Ridgefield Park Twp, Bergen 5.76% $9,954,168 $541,907
- Alpine Boro, Bergen 5.88% $182,232 $10,122
- Readington Twp, Hunterdon 5.88% $1,709,224 $94,958
- Stratford Boro, Camden 5.94% $5,099,935 $285,923
- Mountain Lakes Boro, Morris 6.04% $887,953 $50,548
- Medford Lakes Boro, Burlington 6.06% $1,579,371 $90,169
- Pennsville, Salem 6.07% $10,069,436 $576,637
- Branchburg Twp, Somerset 6.10% $2,403,375 $138,073
- Passaic Co Manchester Reg, Passaic 6.19% $9,287,360 $541,602
- Pompton Lakes Boro, Passaic 6.21% $4,488,644 $262,272
- Westville Boro, Gloucester 6.21% $2,845,365 $166,298
- East Rutherford Boro, Bergen 6.21% $742,172 $43,419
- Hillside Twp, Union 6.22% $24,537,481 $1,436,490
- Edgewater Park Twp, Burlington 6.28% $7,656,315 $452,568
- Little Ferry Boro, Bergen 6.30% $4,560,636 $270,461
- Mount Olive Twp, Morris 6.31% $16,991,935 $1,008,687
- Wharton Boro, Morris 6.31% $4,887,020 $290,119
- Salem County Vocational, Salem 6.32% $5,412,417 $321,711
- East Hanover Twp, Morris 6.37% $839,741 $50,288
- Franklin Lakes Boro, Bergen 6.42% $967,539 $58,385
- Wallington Boro, Bergen 6.48% $5,270,059 $320,619
- Guttenberg Town, Hudson 6.49% $8,056,969 $490,859
- Plainfield City, Union 6.50% $140,835,732 $8,594,435
- Mercer County Vocational, Mercer 6.53% $2,794,150 $171,240
- Cherry Hill Twp, Camden 6.53% $18,424,898 $1,129,628
- Netcong Boro, Morris 6.55% $1,628,736 $100,152
- Egg Harbor City, Atlantic 6.57% $5,932,228 $365,947
- Loch Arbour, Monmouth 6.59% $4,204 $260
- Atlantic Highlands Boro, Monmouth 6.60% $203,490 $12,593
- Bedminster Twp, Somerset 6.75% $822,289 $51,960
- Oceanport Boro, Monmouth 6.79% $531,890 $33,802
- Swedesboro-Woolwich, Gloucester 6.84% $8,096,866 $518,310
- Norwood Boro, Bergen 6.85% $496,242 $31,820
- Lawrence Twp, Mercer 6.89% $4,220,208 $272,090
- Long Hill Twp, Morris 6.93% $788,191 $51,053
- Riverside Twp, Burlington 7.01% $12,554,021 $822,049
- Ewing Twp, Mercer 7.05% $13,007,061 $856,416
- Waldwick Boro, Bergen 7.08% $1,612,445 $106,639
- Woodland Park, Passaic 7.12% $1,530,838 $101,770
- Wood-Ridge Boro, Bergen 7.12% $946,084 $62,898
- Mahwah Twp, Bergen 7.14% $2,877,436 $191,815
- Roselle Park Boro, Union 7.18% $12,337,582 $826,014
- Middlesex Boro, Middlesex 7.20% $10,268,161 $689,218
- Springfield Twp, Union 7.27% $2,087,986 $141,431
- Clayton Boro, Gloucester 7.30% $11,592,524 $788,759
- Southern Regional, Ocean 7.55% $2,501,449 $175,607
- Allamuchy Twp, Warren 7.64% $661,608 $46,975
- Franklin Twp, Hunterdon 7.67% $366,549 $26,124
- Hasbrouck Heights Boro, Bergen 7.68% $2,692,927 $191,953
- Boonton Twp, Morris 7.70% $597,554 $42,713
- Prospect Park Boro, Passaic 7.81% $9,311,817 $674,783
- North Haledon Boro, Passaic 7.85% $486,313 $35,390
- South River Boro, Middlesex 7.91% $15,085,370 $1,105,605
- Saddle River Boro, Bergen 7.92% $393,092 $28,832
- Bordentown Regional, Burlington 7.97% $9,387,174 $693,177
- Carteret Boro, Middlesex 8.00% $31,564,910 $2,338,435
- Hammonton Town, Atlantic 8.02% $20,860,100 $1,549,469
- Rochelle Park Twp, Bergen 8.09% $572,145 $42,804
- Rahway City, Union 8.09% $24,284,880 $1,817,589
- Watchung Boro, Somerset 8.20% $592,997 $44,961
- Hanover Twp, Morris 8.22% $1,115,840 $84,788
- Cranford Twp, Union 8.24% $2,841,003 $216,159
- Green Brook Twp, Somerset 8.27% $1,222,581 $93,368
- Cliffside Park Boro, Bergen 8.29% $5,351,749 $409,852
- Robbinsville Twp, Mercer 8.30% $7,341,597 $562,659
- Old Tappan Boro, Bergen 8.32% $479,819 $36,856
- Belleville Town, Essex 8.34% $30,700,008 $2,364,169
- W Windsor-Plainsboro Reg, Mercer 8.36% $9,279,378 $715,796
- Westwood Regional, Bergen 8.38% $2,212,322 $170,961
- Merchantville Boro, Camden 8.38% $3,408,623 $263,613
- Harding Township, Morris 8.40% $443,316 $34,359
- Kinnelon Boro, Morris 8.45% $1,867,934 $145,520
- Passaic Valley Regional, Passaic 8.45% $1,273,889 $99,277
- Milltown Boro, Middlesex 8.66% $1,611,175 $128,380
- Cranbury Twp, Middlesex 8.86% $633,272 $51,525
- Kearny Town, Hudson 8.86% $41,667,813 $3,391,922
- Totowa Boro, Passaic 8.87% $717,002 $58,436
- Denville Twp, Morris 8.88% $1,497,271 $122,144
- Bergenfield Boro, Bergen 8.93% $13,000,672 $1,065,251
- Saddle Brook Twp, Bergen 9.00% $1,407,599 $116,165
- Lindenwold Boro, Camden 9.01% $29,414,073 $2,432,243
- Bogota Boro, Bergen 9.02% $6,649,885 $550,179
- Hanover Park Regional, Morris 9.03% $1,477,080 $122,317
- Carlstadt-East Rutherford, Bergen 9.05% $467,457 $38,779
- New Milford Boro, Bergen 9.12% $2,386,259 $199,412
- Haworth Boro, Bergen 9.13% $287,268 $24,040
- Bayonne City, Hudson 9.16% $65,499,963 $5,496,002
- Roselle Boro, Union 9.30% $27,929,041 $2,376,206
- Montgomery Twp, Somerset 9.35% $4,908,612 $419,656
- Lodi Borough, Bergen 9.39% $20,087,810 $1,724,068
- Newton Town, Sussex 9.42% $7,075,580 $609,314
- Absecon City, Atlantic 9.46% $3,353,912 $289,973
- Dover Town, Morris 9.48% $30,816,503 $2,669,311
- Ho Ho Kus Boro, Bergen 9.50% $683,580 $59,286
- Brielle Boro, Monmouth 9.50% $561,664 $48,735
- Hackettstown, Warren 9.50% $7,037,374 $610,637
- Boonton Town, Morris 9.57% $2,196,613 $191,762
- Bellmawr Boro, Camden 9.61% $6,935,787 $608,131
- Watchung Hills Regional, Somerset 9.62% $1,589,377 $139,510
- Egg Harbor Twp, Atlantic 9.63% $48,158,989 $4,228,730
- East Windsor Regional, Mercer 9.65% $26,329,678 $2,317,954
- Bloomfield Twp, Essex 9.66% $30,345,478 $2,674,152
- Little Falls Twp, Passaic 9.67% $694,789 $61,283
- Shore Regional, Monmouth 9.76% $602,588 $53,570
- Kingsway Regional, Gloucester 9.82% $12,881,174 $1,152,061
- Englewood Cliffs Boro, Bergen 9.85% $454,775 $40,773
- Haledon Boro, Passaic 9.90% $8,314,346 $748,913
- Sayreville Boro, Middlesex 9.91% $27,976,475 $2,521,608
- North Plainfield Boro, Somerset 9.98% $29,798,639 $2,704,024
- Freehold Boro, Monmouth 10.04% $15,254,482 $1,391,915
- East Greenwich Twp, Gloucester 10.11% $4,500,791 $413,326
- Parsippany-Troy Hills Twp, Morris 10.15% $6,091,659 $561,507
- Warren Twp, Somerset 10.20% $1,658,159 $153,445
- Jamesburg Boro, Middlesex 10.21% $6,457,518 $598,382
- Mountainside Boro, Union 10.24% $841,306 $78,135
- Manville Boro, Somerset 10.29% $10,295,422 $960,390
- Delran Twp, Burlington 10.30% $15,567,631 $1,453,121
- Montville Twp, Morris 10.30% $3,007,620 $280,950
- Union County Vocational, Union 10.37% $10,434,205 $980,730
- Wyckoff Twp, Bergen 10.38% $1,354,132 $127,313
- Holmdel Twp, Monmouth 10.39% $2,582,563 $243,136
- Red Bank Boro, Monmouth 10.41% $6,113,369 $576,150
- Harrington Park Boro, Bergen 10.44% $421,711 $39,869
- Shrewsbury Boro, Monmouth 10.46% $316,838 $30,004
- Allendale Boro, Bergen 10.50% $562,878 $53,493
- Berkeley Heights Twp, Union 10.50% $1,728,031 $164,265
- Chesterfield Twp, Burlington 10.55% $2,657,295 $253,515
- Rumson Boro, Monmouth 10.56% $671,792 $64,169
- River Edge Boro, Bergen 10.57% $2,140,660 $204,704
- Northern Valley Regional, Bergen 10.62% $1,613,998 $154,984
- Mendham Boro, Morris 10.64% $335,155 $32,224
- Ramapo-Indian Hill Reg, Bergen 10.66% $2,019,305 $194,560
- Woodcliff Lake Boro, Bergen 10.66% $490,370 $47,252
- Fair Haven Boro, Monmouth 10.67% $592,268 $57,080
- Mendham Twp, Morris 10.70% $631,363 $61,011
- Ramsey Boro, Bergen 10.85% $1,773,778 $173,616
- Upper Saddle River Boro, Bergen 10.85% $769,057 $75,260
- Hopewell Valley Regional, Mercer 10.85% $3,591,225 $351,448
- Somerville Boro, Somerset 10.86% $7,560,660 $740,361
- Cedar Grove Twp, Essex 10.89% $1,158,678 $113,771
- Montvale Boro, Bergen 10.90% $738,390 $72,591
- Demarest Boro, Bergen 10.91% $435,453 $42,821
- Summit City, Union 10.91% $2,567,656 $252,592
- Millburn Twp, Essex 10.95% $3,519,108 $347,449
- River Vale Twp, Bergen 11.00% $754,595 $74,791
- Fairfield Twp, Essex 11.00% $502,556 $49,816
- Wayne Twp, Passaic 11.00% $5,728,299 $567,808
- Rumson-Fair Haven Reg, Monmouth 11.03% $776,014 $77,115
- Caldwell-West Caldwell, Essex 11.05% $1,826,404 $181,763
- Paramus Boro, Bergen 11.06% $2,885,536 $287,330
- Cresskill Boro, Bergen 11.10% $1,163,819 $116,295
- Roseland Boro, Essex 11.18% $368,230 $37,014
- Clark Twp, Union 11.21% $1,432,981 $144,501
- Riverdale Boro, Morris 11.22% $362,126 $36,520
- Bernards Twp, Somerset 11.23% $4,666,622 $470,965
- South Orange-Maplewood, Essex 11.25% $5,600,317 $566,432
- Little Silver Boro, Monmouth 11.29% $548,335 $55,626
- Pascack Valley Regional, Bergen 11.32% $1,564,936 $159,093
- Rockleigh, Bergen 11.33% $38,966 $3,965
- Glen Ridge Boro, Essex 11.38% $1,230,738 $125,745
- New Providence Boro, Union 11.38% $1,609,620 $164,505
- Glen Rock Boro, Bergen 11.41% $1,653,503 $169,379
- Scotch Plains-Fanwood Reg, Union 11.41% $4,007,387 $410,448
- Emerson Boro, Bergen 11.45% $755,810 $77,677
- Northern Highlands Reg, Bergen 11.45% $877,439 $90,135
- Madison Boro, Morris 11.48% $1,698,371 $174,847
- River Dell Regional, Bergen 11.49% $1,104,010 $113,813
- Livingston Twp, Essex 11.49% $4,612,412 $475,247
- Sch Dist Of The Chathams, Morris 11.49% $2,999,890 $309,073
- Ridgewood Village, Bergen 11.55% $3,879,179 $401,750
- Park Ridge Boro, Bergen 11.60% $788,428 $81,933
- West Essex Regional, Essex 11.61% $1,553,271 $161,584
- Oakland Boro, Bergen 11.69% $971,877 $101,720
- Haddonfield, Camden 11.71% $1,685,574 $176,752
- Maple Shade Twp, Burlington 11.75% $11,467,860 $1,205,675
- Monroe Twp, Middlesex 11.79% $5,915,557 $623,857
- Westfield Town, Union 11.82% $4,281,274 $452,693
- Carlstadt Boro, Bergen 11.84% $366,956 $38,861
- Metuchen Boro, Middlesex 11.89% $1,532,663 $162,909
- Dunellen Boro, Middlesex 11.95% $8,551,876 $913,107
- Fort Lee Boro, Bergen 11.98% $3,031,867 $324,448
- Fair Lawn Boro, Bergen 11.99% $7,112,643 $761,447
- Verona Boro, Essex 12.04% $1,442,837 $155,100
- Somerset Hills Regional, Somerset 12.04% $1,455,450 $156,385
- Closter Boro, Bergen 12.12% $777,745 $84,063
- Northvale Boro, Bergen 12.12% $333,418 $36,040
- Oradell Boro, Bergen 12.20% $477,073 $51,861
- Edgewater Boro, Bergen 12.34% $1,347,038 $147,997
- Tenafly Boro, Bergen 12.34% $2,461,040 $270,274
- Bound Brook Boro, Somerset 12.41% $15,507,546 $1,711,628
- Florham Park Boro, Morris 12.59% $700,183 $78,313
- North Caldwell Boro, Essex 13.05% $454,280 $52,451
- Secaucus Town, Hudson 13.05% $1,856,959 $214,386
- West Orange Town, Essex 13.06% $13,899,992 $1,606,160
- Passaic County Vocational, Passaic 13.19% $29,919,248 $3,485,615
- Linden City, Union 13.45% $30,940,458 $3,668,890
- Essex Fells Boro, Essex 14.24% $139,024 $17,327
- West Long Branch Boro, Monmouth 14.33% $393,211 $49,271
- Hi Nella, Camden 14.43% $1,189,683 $150,025
- Clifton City, Passaic 14.52% $40,146,519 $5,089,651
- North Arlington Boro, Bergen 14.64% $3,756,115 $479,622
- Hackensack City, Bergen 14.96% $22,096,964 $2,875,682
- Fairview Boro, Bergen 15.61% $14,596,673 $1,971,395
- Edison Twp, Middlesex 16.21% $22,970,486 $3,203,861
- Elmwood Park, Bergen 16.73% $9,893,393 $1,417,898
- South Hackensack Twp, Bergen 16.78% $345,738 $49,678
- Atlantic Co Vocational, Atlantic 17.39% $10,198,583 $1,511,165
- North Brunswick Twp, Middlesex 19.08% $22,449,469 $3,597,220
- Cumberland Co Vocational, Cumberland 19.76% $6,318,146 $1,042,690
- Woodbridge Twp, Middlesex 21.78% $41,340,262 $7,392,702
- Atlantic City, Atlantic 39.23% $40,437,510 $11,393,406
- Lakewood Twp, Ocean 63.66% $38,404,229 $14,938,768
Get more local news delivered straight to your inbox. Sign up for free Patch newsletters and alerts.