Schools
Fair Lawn Test Scores Trump State Average
Fair Lawn compares favorably to school districts in similar socioeconomic circumstances

Fair Lawn schools easily exceeded statewide proficiency averages for both regular and special education students in this past year's state education assessments, administered annually by the New Jersey Department of Education.
The Department of Education presented Wednesday the results of the 2010-2011 New Jersey Assessment of Skills and Knowledge (NJ ASK) -- taken by third through eighth graders -- and the High School Proficiency Assessment (HSPA) -- administered to students during their 11th grade year.
for economically disadvantaged, African American and Hispanic students.
Find out what's happening in Fair Lawn-Saddle Brookfor free with the latest updates from Patch.
Such achievement gaps also exist in Fair Lawn, but to a significantly smaller extent than they do across the state on average.
Year-to-Year
Find out what's happening in Fair Lawn-Saddle Brookfor free with the latest updates from Patch.
Fair Lawn's proficiency scores are up in both language arts literacy and math from last year for both regular and special education students. The district saw its greatest gains at the elementary level, where scores increased almost across the board for both individual grades and subjects.
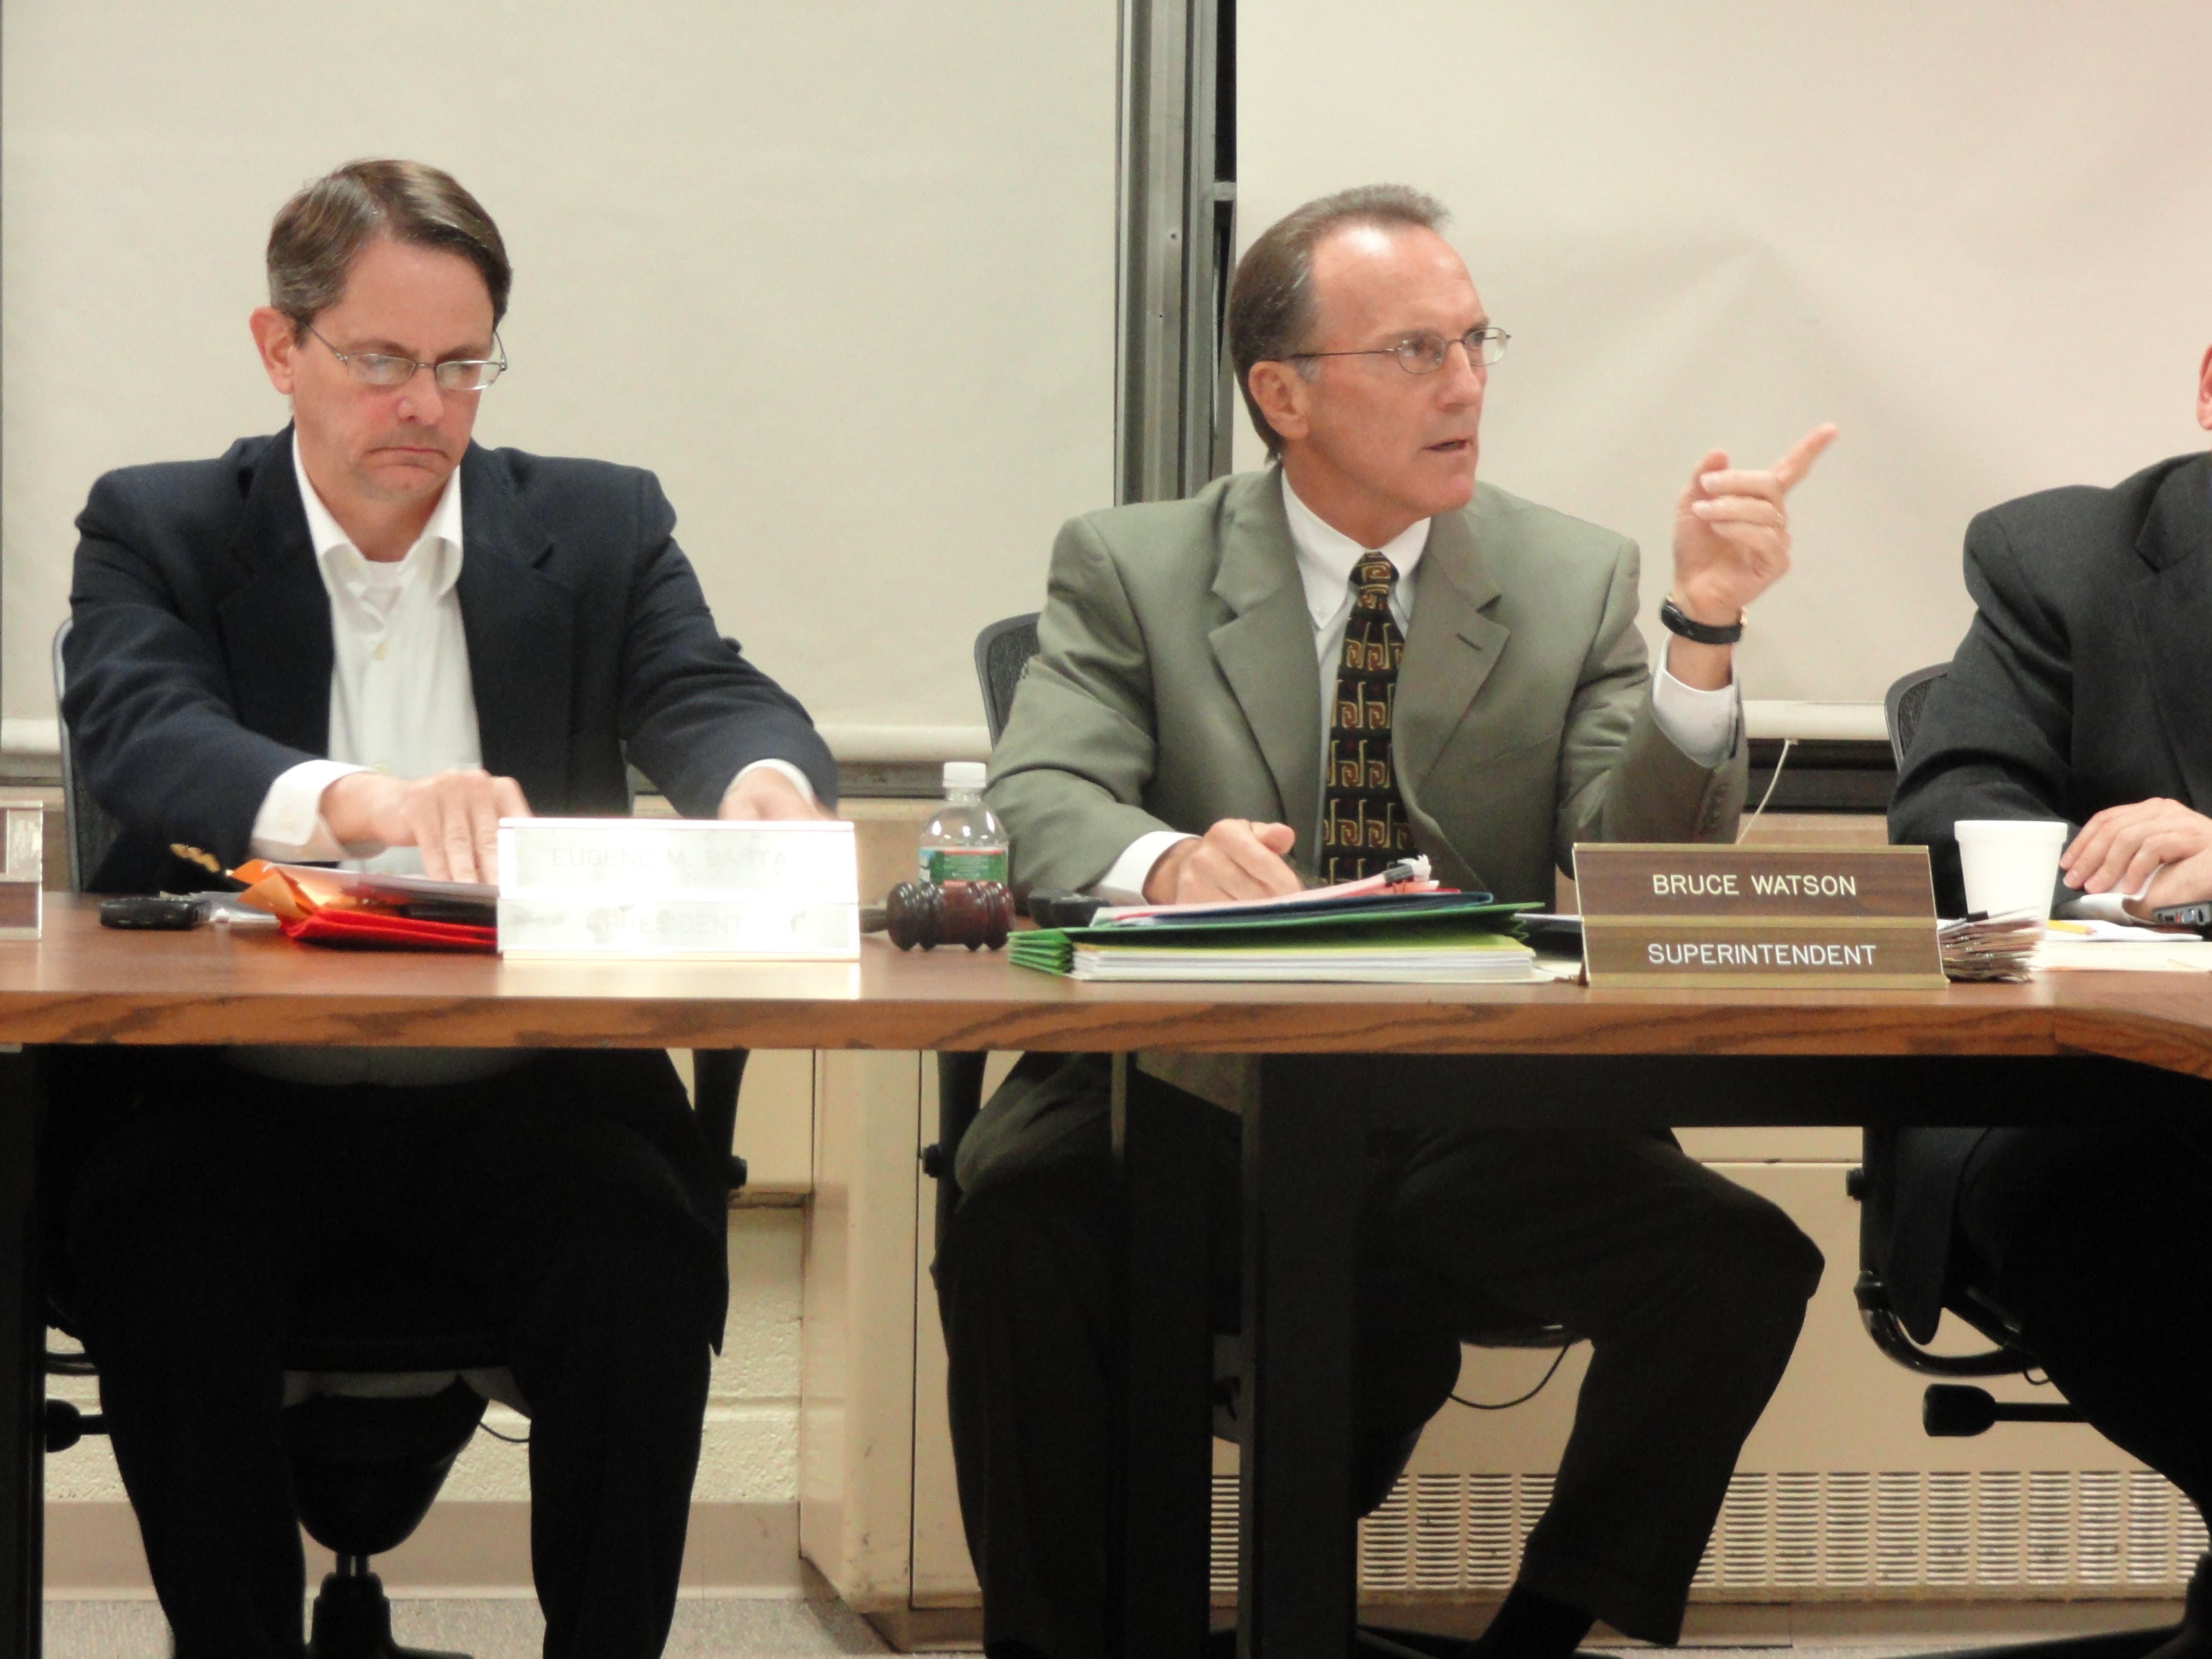
"I think there’s definitely a growth pattern going forward that is obvious if you look at it overall," Superintendent Bruce Watson said, calling the results extremely encouraging.
He said he expects next year's achievement scores to rise even higher.
"We actually expect them to really have a very good jump to them," Watson said. "Because we’ve made a lot of changes in the way that we are preparing the kids to take the tests and the way the teachers are preparing for the teaching."
Performing micro-level analyses of the voluminous amounts of test data has enabled the district to better identify its strengths and weaknesses via direct comparison.
Watson said last year was the first time they dug into the data -- school by school -- to tease out the overachievers and the underachievers within the district so best practices could be shared between teachers and principals.
"We looked at those schools that have outscored other schools in our district to see what some of the strategies the better-scoring schools have used and how can we duplicate those," Watson said.
The analysis actually goes beyond individual schools, right down to the results of individual sections of the tests.
"In math, you might have a series of questions in Geometry, and we either did or didn't do well in those," Watson said. "So now we know we need to revisit or teach differently that particular focus...We're really analyzing data much deeper than ever before."
Other methods the district is employing to boost achievement include incorporating a balanced literacy approach, and the creation of smaller writing groups and language labs that allow students to spend more time on language arts literacy on a daily basis.
In an attempt to improve the math scores for special education students, the district has created smaller classes that are being taught by regular certified teachers, which Watson said he believes will help tremendously.
Beating the DFG
While Fair Lawn's test scores regularly trump the state's average scores by double digit percentages, the more apt comparison is to school districts with students in similar socioeconomic circumstances.
That's why when the district compares its test data, it does so against districts in the same district factor group (DFG). District factor groups range from A (the lowest socioeconomic districts) to J (the highest socioeconomic districts). Fair Lawn is in the "GH" group. By comparison, neighboring Paterson is in the "A" group, while Glen Rock and Ridgewood are both in the "J" group.
When compared to it's DFG, Fair Lawn soars, besting its peers in virtually every subgroup and subject.
"Fair Lawn, either in Language Arts Literacy or Math, or both in some schools, has outscored most of Bergen County," Watson said.
Fair Lawn's scores across the board still don't quite match up with the wealthiest districts in the "I" and "J" categories, but they're getting closer.
"Compare us with even wealthier districts and we actually compare better than we have in the past," Watson said. "Some of the schools that outscored us by a few points were the I's and the J's of the wealthier districts, but we beat many of them."
--
For a look at how Fair Lawn's 2010-2011 NJ ASK and HSPA scores compare to state averages:
All Students
Grade
Proficient LAL(FL) Proficient LAL (State) Difference LAL Proficient M (FL) Proficient M (State) Difference M 3 76.8% 63%+13.8%
94.2% 78.9% +15.3% 4 74.7% 62.7% +12% 90.8% 79.3% +11.5% 5 76.1% 60.9% +15.2% 94.4% 80.6% +13.8% 6 78.7% 66.7% +12% 84% 77.3% +6.7% 7 77.9% 63.3% +14.6% 77.8% 65.7% +12.1% 8 91.9% 82.2% +9.7% 82.3% 71.5% +10.8% NJ ASK (3-8) 79.4% 66.5% +12.9% 87.3% 75.6% +11.7% HSPA 96.8% 89.5% +7.3% 89.3% 75.2%+14.1%
Key: LAL=Language Arts Literacy; M=Math; FL=Fair Lawn Schools
Socioeconomic Outlook in Fair Lawn
Grade Proficient LAL (ED) Proficient LAL (NED) Difference LAL Proficient M (ED) Proficient M (NED) Difference M 3 65.7% 78.1% -12.4% 82.9% 95.5% -12.6% 4 54.2% 78% -23.8% 75% 93.3% -18.3% 5 60% 77.3% -17.3% 92% 94.6% -2.6% 6 69% 79.6% -10.6% 61.3% 86.3% -24% 7 58.7% 80.4% -21.7% 62.2% 79.7% -17.5% 8 75.9% 93.2% -17.3% 72.4% 83.1% -10.7% NJ ASK (3-8) 63.9% 81.1% -17.2% 74.3% 88.75% -14.5% HSPA 100% 96.6% +0.4% 78.9% 89.8% -10.9% SNJASK (3-8) 46.6% 77.1% -30.5% 59.6% 84% -20.4% S HSPA 78.7% 93.2% -14.5% 56.3% 81.6% -25.3%Key: LAL=Language Arts Literacy; M=Math; ED=Economically Disadvantaged; NED= Not Economically Disadvantaged
Ethnic Outlook in Fair Lawn
Grade Proficient LAL (W) Proficient LAL (A) Proficient LAL (H) Proficient M (W) Proficient M (A) Proficient M (H) 3 75.3% 87.2% 72.9% 94.4% 97.9% 89.6% 4 77.3% 85.1% 60.7% 92.6% 95.7% 80.4% 5 75.5% 88.6% 71.1% 94.7% 100% 91.3% 6 83% 83.7% 64.7% 88.7% 88.9% 71.5% 7 80.9% 76.6% 56.1% 79.9% 92.2% 51.2% 8 93.6% 93.5% 86.5% 83.1% 97.8% 65.4% FLNJ ASK (3-8) 80.9% 85.8% 68.7% 88.9% 95.4% 74.9% FLHSPA 97.2% 100% 92.9% 92.6% 91.2% 76.2% SNJASK (3-8) 76.8% 84.2% 50.3% 84.6% 92.2% 63.7% SHSPA 94.8% 94.8% 80.4% 84.8% 91.7% 59.7%Key: LAL=Language Arts Literacy; M=Math; W=White, A=Asian; H=Hispanic; FL = Fair Lawn; S=State
Get more local news delivered straight to your inbox. Sign up for free Patch newsletters and alerts.