Schools
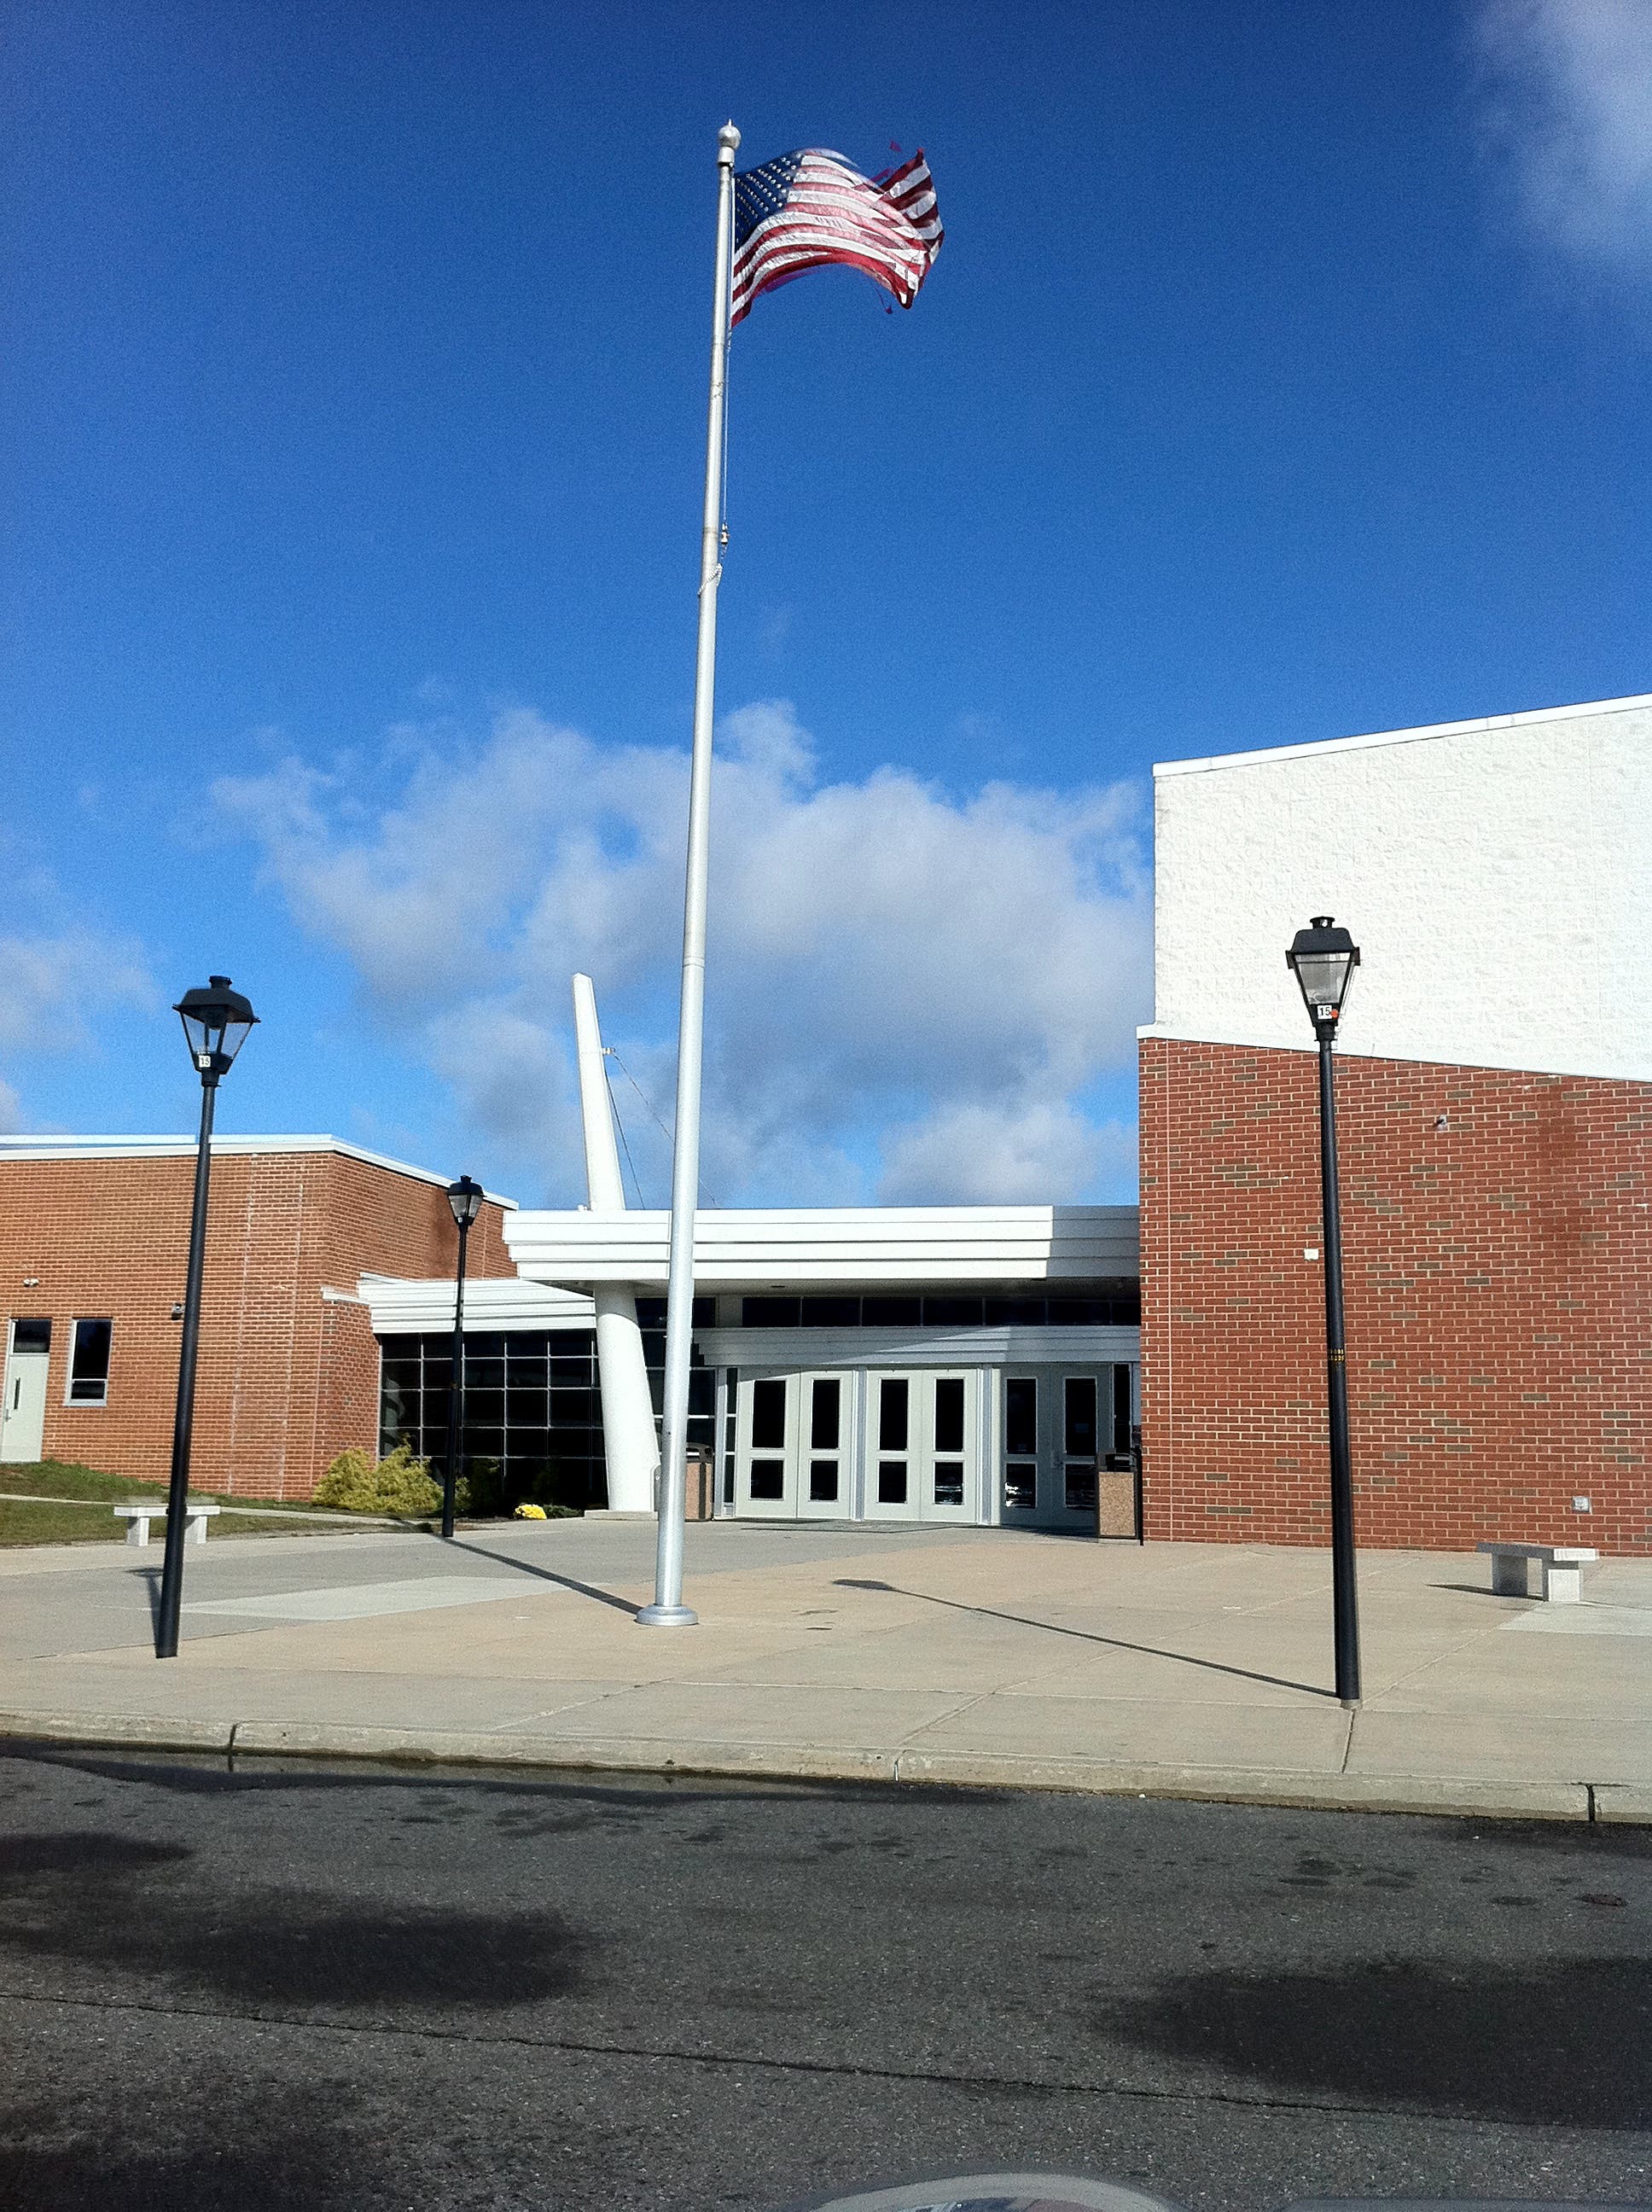
Galloway School District, Absegami High School in Line With Statewide Testing Results
NJASK and HSPA testing results were released this week.

Results of the New Jersey Assessment of Skills and Knowledge (NJASK) testing from last spring were released this week, and while the State Department of Education (NJDOE) says the results indicate a slight improvement, it points to an achievement gap for the economically disadvantaged.
NJDOE said overall performance held steady or improved slightly in nearly all grades and subjects.
“We approach these results today with both confidence and humility," acting Department of Education Commissioner Christopher Cerf said. "Overall, New Jersey students continue to perform at extremely high levels overall, and with few exceptions the statewide numbers continue to inch upwards. However, we have a persistent achievement gap that leaves our economically disadvantaged, African American, and Hispanic students far behind their peers. It is a disgraceful legacy in New Jersey that leaves tens of thousands of students behind each year – and has for decades. We must be honest with ourselves and our communities about this achievement gap, and be impatient and relentless in doing everything we can to close it once and for all.”
Find out what's happening in Gallowayfor free with the latest updates from Patch.
At Monday night's Board of Education meeting, Galloway Township Superintendent of Schools Annette Giaquinto said recent studies show the school breakfast and lunch programs are available to the economically disadvantaged children in the school district. However, many more children take advantaged of school lunch than school breakfast, so she proposed a study of the breakfast eating habits of school children, at no cost to the taxpayer.
NJASK testing is administered to students statewide in third-eighth grades in the areas of Language Arts and Math. Students in fourth and eighth grade are also tested in Science.
Find out what's happening in Gallowayfor free with the latest updates from Patch.
Student scores are broken down into three categories: Partially Proficient (PP), Proficient (P) and Advanced Proficient (AP). Partially Proficient is considered below average, Proficient is average and Advanced Proficient is above average.
High schools use the same method of categorizing scores for the High School Proficiency Assessment (HSPA) and the Biology Competency Test.
In many areas, the was right in line with, or slightly higher than, the state average proficiency. was higher than the state average in Language Arts and Math, as well as in the Biology Competency testing.
Full results, including the school-by-school breakdown for Galloway, are available here.
An overview of the Galloway School District, Absegami High School and the state scores can be found below.
Grade 3, NJ ASK: Language Arts
Partially Proficient
Proficient
Advanced Proficient
Galloway 2011
50.3
47.7
2.1
Galloway 2010
48.4
49.9
1.7
Galloway 2009
45.6
50.9
3.5
State Average 2011
37.0
55.8
7.2
State Average 2010
40.3
54.1
5.6
State Average 2009
37.3
56.9
5.8
Grade 3, NJ ASK: Math
Galloway 2011
33.9
44.0
22.1
Galloway 2010
20.4
49.0
30.6
Galloway 2009
31.1
43.7
25.2
State Average 2011
21.1
40.5
38.4
State Average 2010
21.9
41.1
37.1
State Average 2009
24.8
43.3
31.9
Grade 4, NJ ASK: Language Arts
Partially Proficient
Proficient
Advanced Proficient
Galloway 2011
41.7
55.2
3.1
Galloway 2010
51.5
45.9
2.5
Galloway 2009
42.1
56.2
1.7
State Average 2011
37.3
55.5
7.2
State Average 2010
40.4
50.3
9.3
State Average 2009
37.0
56.3
6.7
Grade 4, NJ ASK: Math
Galloway 2011
20.9
48.0
31.0
Galloway 2010
28.9
42.1
28.9
Galloway 2009
27.3
50.3
22.4
State Average 2011
20.7
47.2
32.1
State Average 2010
23.0
42.2
34.8
State Average 2009
27.0
45.5
27.5
Grade 4, NJ ASK: Science
Galloway 2011
8.4
50.0
41.6
Galloway 2010
7.9
58.0
34.1
Galloway 2009
12.0
53.6
34.4
State Average 2011
10.0
42.3
47.7
State Average 2010
6.6
49.2
44.2
State Average 2009
9.1
44.0
47.0
Grade 5, NJ ASK: Language Arts
Partially Proficient
Proficient
Advanced Proficient
Galloway 2011
43.5
54.6
2.0
Galloway 2010
36.6
57.7
5.7
Galloway 2009
30.0
63.3
6.7
State Average 2011
39.1
54.8
6.1
State Average 2010
36.9
54.3
8.7
State Average 2009
34.2
57.1
8.7
Grade 5, NJ ASK: Math
Galloway 2011
24.0
43.0
33.1
Galloway 2010
18.4
47.8
33.8
Galloway 2009
17.8
46.2
35.9
State Average 2011
19.4
41.1
39.5
State Average 2010
21.3
42.0
36.8
State Average 2009
22.7
45.3
32.1
Grade 6, NJ ASK: Language Arts
Partially Proficient
Proficient
Advanced Proficient
Galloway 2011
26.7
65.1
6.2
Galloway 2010
32.6
60.8
6.6
Galloway 2009
28.8
66.1
5.0
State Average 2011
33.3
59.4
7.3
State Average 2010
34.7
57.7
7.6
State Average 2009
30.2
62.6
7.2
Grade 6, NJ ASK: Math
Galloway 2011
19.6
51.5
29.0
Galloway 2010
22.2
53.4
24.4
Galloway 2009
23.6
44.7
31.7
State Average 2011
22.7
49.8
27.6
State Average 2010
28.2
48.3
23.5
State Average 2009
29.1
45.6
25.3
Grade 7, NJ ASK: Language Arts
Partially Proficient
Proficient
Advanced Proficient
Galloway 2011
35.7
54.7
9.6
Galloway 2010
34.9
52.5
12.6
Galloway 2009
26.9
60.3
12.9
State Average 2011
36.7
51.0
12.3
State Average 2010
30.8
51.7
17.5
State Average 2009
28.1
53.7
18.2
Grade 7, NJ ASK: Math
Galloway 2011
34.7
47.3
17.9
Galloway 2010
32.8
43.8
23.4
Galloway 2009
32.9
46.2
21.0
State Average 2011
34.3
41.4
24.3
State Average 2010
35.7
39.9
24.4
State Average 2009
33.7
42.6
23.7
Grade 8, NJ ASK: Language Arts
Partially Proficient
Proficient
Advanced Proficient
Galloway 2011
16.3
68.8
14.9
Galloway 2010
18.7
68.8
12.5
Galloway 2009
31.1
45.9
23.0
State Average 2011
17.8
63.0
19.1
State Average 2010
17.6
64.1
18.4
State Average 2009
18.1
70.9
11.1
Grade 8, NJ ASK: Math
Galloway 2011
30.7
40.7
28.6
Galloway 2010
36.9
44.7
18.4
Galloway 2009
17.6
75.9
6.5
State Average 2011
28.5
41.1
30.4
State Average 2010
31.5
39.4
29.1
State Average 2009
28.8
41.7
29.5
Grade 8, NJ ASK: Science
Galloway 2011
18.5
55.8
25.7
Galloway 2010
12.8
57.2
30.0
Galloway 2009
12.8
62.5
24.7
State Average 2011
18.8
51.9
29.3
State Average 2010
17.0
51.5
31.4
Stage Average 2009
15.9
53.8
30.4
HSPA (Typically Given in Grade 11): Language Arts
Partially Proficient
Proficient
Advanced Proficient
Absegami 2011
7.4
75.6
17.0
Absegami 2010
11.2
70.1
18.8
Absegami 2009
22.3
73.6
4.1
State Average 2011
10.5
68.8
20.8
State Average 2010
12.9
68.7
18.4
State Average 2009
16.4
70.2
13.4
HSPA (Typically Given in Grade 11): Math
Absegami 2011
22.3
59.7
18.1
Absegami 2010
26.6
51.8
21.6
Absegami 2009
34.2
54.4
11.4
State Average 2011
24.8
49.9
25.3
State Average 2010
25.9
50.1
24.0
State Average 2009
27.2
49.7
23.0
New Jersey Biology Competency
Partially Proficient
Proficient
Advanced Proficient
Absegami 2011
32.0
46.3
21.7
Absegami 2010
34.0
47.7
18.3
State Average 2011
42.7
38.0
19.3
State Average 2010
44.1
41.7
14.2
Get more local news delivered straight to your inbox. Sign up for free Patch newsletters and alerts.