Health & Fitness
Maplewood 3rd Quarter Real Estate Results: More Homes Sold for a Little Less
Hear directly from new homeowners on why they chose Maplewood as the place to call home and see how many homes sold in 3Q and how prices are doing.

New homeowners Richard and Eva Cunningham were one of the many buyers who chose Maplewood as the place to call home this summer after Robert Meaux, Jr. showed them various homes in the area. They considered other towns like South Orange, Westchester County river towns and some areas in Connecticut like Stanford and Fairfield, and settled in on Maplewood.
“We chose Maplewood because it is an outstanding community with great houses and neighborhoods and everyone who lives here loves it, which is always a good sign,” the Cunninghams noted. “Also, it's close to the city and we have family here and nearby.”
Seventy-nine other sets of homebuyers agreed with the Cunninghams last quarter (July – September) that Maplewood was the place to live with residential homes selling in town for the low of $91,000 to the high of $890,000. More homes sold this quarter than in the first and second, which had 46 and 70 residential home sales respectively, but the third quarter average sales price of $476,021 (median of $482,500) couldn’t beat the second quarter average sales price of $500,717 (median of $507,500). Of the 80 residential homes sold in third quarter, 5 were and 3 were foreclosures. See the attached document for a list of all the residential and multi-family homes sold during the third quarter and for all the homes sold during the first 6 months of the year.
Find out what's happening in Maplewoodfor free with the latest updates from Patch.
Maplewood 2011 Residential Home Sales
Find out what's happening in Maplewoodfor free with the latest updates from Patch.
Monthly Snapshot
MONTH
TOTAL SOLD
AVG LIST PRICE
AVG SALES PRICE
SP/LP%
DOM
September
23
$468,726
$452,000
94.8%
58
August
35
$516,129
$501,859
96.4%
65
July
22
$484,041
$460,027
95.3%
85
June
33
$493,882
$484,167
96.8%
63
May
27
$513,396
$499,137
96.9%
62
April
10
$566,770
$559,600
98.5%
30
March
15
$582,327
$568,867
97.5%
73
February
16
$428,612
$417,285
97.0%
75
January
15
$425,726
$418,213
97.5%
73
SUMMARY
196
$496,430
$482,728
96.5%
66
SP/LP% (sales price / list price) = property sold at what percentage of list price; DOM = Days on Market for final listing period; AVG = average.
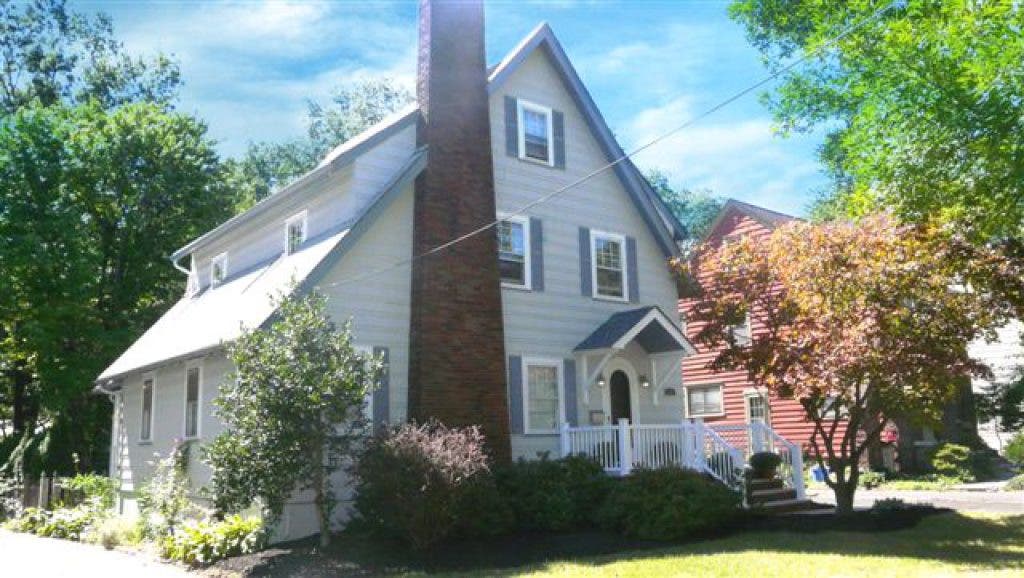
“I love the house we bought on Oakland Road,” said Richard. “It's got a lot of character and it has been very well maintained and updated. I also love the view that we have of the other houses on our block as they are all unique and quite handsome.”
Home buyers searched online, talked to their friends and neighbors, and ventured out to public open houses as they put their foot in the water to see what prices sellers were thinking. They took their time to study the market before they walked through the door and, when they were interested -- as Bob and I saw when we represented the sellers at 387 Elmwood Avenue that traded in September for $410,000 – they were ready with questions and strategies for the sellers and REALTORS® to demonstrate why this was the house for them. Homeowners experienced this almost across the board during the third quarter.
Twenty-four percent of the residential homes that sold during this time period were either at or over asking price: 7 were over asking price, 12 at asking price, also 17 were within $10,000 of the asking price. Pricing is always relative, though, and when we work with buyers and sellers we like to look under these numbers to help them in their decision making. For example, out of the 19 residential homes that sold at or over asking price, Bob and I researched that just over half, 52.7%, either had at least one price reduction before it sold or was previously listed in the past 12 months at a higher price than what it traded. If we take this into account, only 9 homes out of the 80 sold between July – September actually sold at or over its original asking price in an average of only 26 days with an average sales price of $660,222. These 9 homes were represented by 8 different REALTORS® across 6 different Real Estate agency offices. A large majority of them may not have been professionally staged, but they were all clean, de-cluttered and in move-in-condition.
According to Richard Cunningham, the condition of the home is very important, “obviously it should be clean and without visible clutter, but also the majority of the small ‘wear and tear’ issues should be fixed. I think the natural impulse is to not spend any more money on a house you are trying to sell, but that's the cost of selling and to some degree it makes sense to invest in the sale.”
Year-over-year the third-quarter 2011 average sales price is the lowest it has been since 2003, while the number of homes sold has stayed relatively constant between 78 and 88 since 2007. The average SP/LP ratio, which is the percentage difference between how much a home was listed for compared to what it actually traded for, was the lowest this year at 95.6% than it has been in the past 11 years. The first half year-over-year comparison was .
Maplewood 2011 Residential Home Sales
Third Quarter (Jul-Sept) Year-to-Year Comparison
YEAR
TOTAL
SOLD
AVG LIST
PRICE
AVG SALES
PRICE
SP/LP%
DOM
2011
80
$493,676
$476,021
95.6%
69
2010
78
$501,068
$489,725
97.6%
74
2009
84
$510,410
$496,896
97.7%
60
2008
88
$555,402
$542,673
97.5%
60
2007
84
$574,614
$571,921
99.7%
42
2006
113
$548,242
$542,763
99.0%
43
2005
134
$523,169
$548,781
104.7%
36
2004
116
$483,551
$496,285
102.6%
43
2003
143
$414,598
$421,903
101.8%
42
2002
125
$397,298
$406,115
102.5%
38
2001
129
$338,935
$343,157
101.5%
40
2000
148
$292,985
$294,157
100.3%
37
When I asked Richard what he would suggest to buyers looking to purchase today, he said they should look at houses after they have a sense of their budget and home price ceiling. “It's good to check out towns and general areas, but know what you can and can't afford (beyond a pre-approval for a mortgage) when you start looking in earnest,” Richard noted.
For sellers, Bob and I suggest having an in-depth discussion with us or your REALTOR® about what number your home translates into combined with some time with a financial advisor, like the one we have on our team, to brainstorm how this will affect your portfolio and future planning. See the big picture in the Real Estate step you are considering taking before you make a decision.
If you’d like an email of all the pictures and listing details of the homes sold in the third quarter send me a note.
Talk to you again soon.
All of this data has been compiled using information from the Garden State Multiple Listing Service (GSMLS) as of October 20, 2011; if changes were made in GSMLS after October 20, 2011 it is not reflected here. The MLS is used by Real Estate agents selling properties in Essex County and other areas. This data does not include private sales or new construction not listed through a Real Estate agent. Towne Realty Group, LLC. Independently Owned and Operated. Bev and Bob Meaux, Salespersons, Towne Realty Group.