Schools
State School Report Cards Show Consistency in Westfield Data
District sees some changes in test scores in new round of state data.

Westfield test scores remained fairly steady over the last school year according to the state school report cards released Tuesday by the state Department of Education.
The report cards show that more students were taking the state mandated tests, as part of the rise in district populations. The scores show some drops in the amount of students scoring in the top place on the tests, as the amount of students taking the test rose.
The data showed a rise in the district’s enrollment, particularly in the elementary school and intermediate grades, an area which has been identified in Board of Education studies to look at going forward.
Find out what's happening in Westfieldfor free with the latest updates from Patch.
Elementary Schools
Test scores for the district’s six elementary schools show that the district shows test scores rising in the advanced category in all but two tests, with the district showing some rise in the partial category on testing and a drop in students scoring proficient.
Find out what's happening in Westfieldfor free with the latest updates from Patch.
Westfield elementary students showed the sharpest rise in the advanced category in the NJ ASK mathematics test for third graders. The report card showed that the percentage of students scoring advanced on the test rose from 52.8-percent in the 2008-09 school year to 61.6-percent in the 2009-10 school year. At the same time the number of students taking the test district-wide dropped from 561 in 2008-09 to 505 in 2009-10. In the same category, Westfield showed the proficient score drop from 40.8-percent in 2008-09 to 38.2-percent in 2009-10. The partial score on the test rose from 6.4-percent in 2008-09 to 7.7-percent in 2009-2010.
The district’s elementary schools showed the sharpest drop in the advanced scoring category in the NJ ASK fourth grade science test. The percentage dropped from 62.1-percent in 2008-09 to 52-percent in 2009-10. At the same time, the amount of students taking the test rose from 472 in 2009-10 to 565 in 2009-10. The proficient scores on the test rose from 37.5-percent to 45.1-percent. The partial score on the test also rose from .6-percent in 2008-09 to 2.8-percent in 2009-10.
The NJ ASK mathematics test of fifth graders also showed a drop in Westfield’s advanced score with a percentage of 71.6-percent in 2008-09 changing to 66.3-percent in 2009-10. At the same time the amount of students taking the test dropped from 511 in 2008-09 to 484 in 2009-10. The proficient score on the test rose from 24.-percent in 2008-09 to 30.8-percent in 2009-2010. The partial score dropped from 3.9-percent in 2008-09 to 2.9-percnet in 2009-2010.
All test scores take into account special education students in the individual schools, along with general education students.
Franklin School
Franklin’s report card showed that the rise in students taking the NJ ASK language arts test for third grade in the past year had an impact on the amount of students scoring in the advanced category. The advanced score dropped from 30.2-percent in 2008-09 to 17.5-percent in 2009-10, at the same time the proficient score rose from 62.9-percent to 71.5-perent and the partial score rose from 6.9-percent to 10.9-percent. The data showed that the amount of students taking the test rose from 116 to 137. Franklin’s scores remained higher than the district and statewide scores for the same tests.
Franklin’s math scores rose in the third grade, along with language arts scores in the fourth grade. The fourth grade NJ ASK language arts test showed a rise in the advanced score from 23.2-percent in 2008-09 to 33-percent in 2009-10. The proficient score dropped from 66.3-percent in 2008-09 to 53.9-percent in 2009-10 and the partial score rose from 10.5-percent to 13-percent. The amount of students taking the test rose from 95 to 115. Fourth grade math and science scores dropped from 2008-09 to according to the report card.
Franklin’s fifth graders showed a rise in test scores from 2008-09 with the advanced score on the NJ ASK math test going from 66.7-percent to 71.6-percent and the partial score dropping from 5.4-percent to zero-percent.
For the Roosevelt report card with complete data sets, click here.
Jefferson School
The report cards show advanced scores at Jefferson dropping in most categories, with a rise in test takers being shown year to year in each grade level being tested. The sharpest drop was in the fifth grade math test with the advanced score dropping from 74.6-percent to 58.5-percent and the proficient score rising from 23.9-percent to 37.8-percent. The partial score in Jefferson on this test rose from 1.5-percent to 3.7-percent. The amount of students taking the test rose from 67 to 82 in the last year.
Jefferson fifth graders on the language arts test showed the advanced score drop from 25.4-percent to 15.9-percent and the proficient score rise from 65.7-percent to 72-percent. The partial score rose from 9-percent to 12.2-percent.
Jefferson’s fourth graders saw a drop in language arts from 15.6-percent to 13.6-percent and proficient drop from 76.6-percent to 69.9-percent. The partial score rose from 7.8-percent to 16.5-percent. The amount of students taking the test rose from 77 in 2008-09 to 103 in 2009-10.
Schools Superintendent Margaret Dolan has said at previous Board of Education meetings that Jefferson is seeing a rise in student population and over the summer briefly considered moving some students to another elementary school. She has also hired reading coaches to assist teachers in language arts instruction due to the rise in student population.
For the Jefferson report card with complete data sets, click here.
McKinley School
McKinley School’s scores remained steady or saw rises in most categories. With recently retired principal Claudia Andreski’s focus on reading and language arts, McKinley’s third and fourth graders saw a rise in the language arts test scores, but the partial percentage remained steady.
McKinley’s third grade language arts scores showed an advanced rise from 6.3-percent to 8.6-percent and the proficient score drop from 75-percent to 61.4-percent. The partial score rose from 18.8-percent to 30-percent. The school showed the amount of test takers drop from 80 to 70. The third grade math scores saw a rise in advanced from 43.8-percent to 51.4-percent, a drop in proficient from 48.8-percent to 34.3-percent and a rise in partial from 7.5-percent to 14.3-percent.
McKinley’s fourth graders showed a rise in math scores, with a sharp increase in the amount of students taking the test. The advanced score rose from 42.9-percent to 50.6-percent, the proficient score dropped slightly from 44.9-percent to 43-percent and the partial score dropped from 12.2-percent to 6.3-percent. The amount of students taking the test rose from 49 to 79.
For the McKinley report card with complete data sets, click here.
Tamaques School
Tamaques third and fourth graders saw a rise in test scores over the past year, while fifth graders saw a slight drop, but remained steady.
The report card showed that Tamaques third graders rose in math scores from 40.9-percent advanced to 54.7-percent advanced, with the proficient score dropping from 49.5-percent to 27.9-percent. The partial score rose from 9.7-percent to 17.4-percent. The amount of students taking the test dropped from 93 to 86.
Tamaques fourth graders showed a rise in math scores from 34.6-percent advanced to 54.5-percent advanced, with the proficient score dropping from 51.3-percent to 32.3-percent and the partial score dropping from 14.1-percent to 13.1-percent. The number of test takers rose from 78 to 99.
Tamaques fifth graders saw a drop in math scores from 78.4-percent to 59.5-percent, a rise in proficient from 17-percent to 35.4-percent and a slight rise in partial from 4.5-percent to 5.1-percent. The number of students taking the test dropped from 88 to 79.
For the Tamaques report card with complete data sets, click here.
Washington School
Scores at Washington remained consistent with some rises and drops in each of the categories.
Washington’s third graders saw a rise in language arts scores and a drop in math scores in the advanced scoring category. The language arts advanced rose from 7.5-perent to 16.4-percent and the proficient dropped from 85.1-percent to 70.5-percent. The partial score rose from 7.5-percent to 13.1-percent. In math, the advanced score dropped from 70.1-percent to 62.3-percent and the proficient rose from 26.9-percent to 36.1-percent. The partial score dropped from 3-percent to 1.6-percent. The amount of test takers in both categories dropped from 61 to 67.
Washington’s math scores outpaced most of the district in the fifth grade, with the advanced score rising from 81.5-percent to 82.5-percent. The proficient score dropped from 16.9-percent to 12.7-percent and the partial score rose from 1.5-percent to 4.8-percent. The amount of test takers dropped from 65 to 63.
For the Washington report card with complete data sets, click here.
Wilson School
Wilson showed a rise or consistency in all but one testing category according to the report card.
The fourth grade state science test showed a drop in scores year-to-year for Wilson. The advanced score dropped from 74.8-percent to 56.9-percent, the proficient score rose from 25.2-percent to 42.2-perecent and the partial score rose from zero-percent to one-percent.
Wilson’s fourth grade math scores remained consistent with the advanced score going from 56.8-percent to 56.9-percent, the proficient going from 41.4-perent to 41.2-percent and the partial going from 1.8-percent to 2-percent.
Third graders at Wilson posted increases with the math advanced score going up from 45.6-percent to 62.2-percent. The proficient score dropping from 45.-6percent to 36.6-percent and the partial score dropping from 8.7-percent to 1.2-percent. The amount of test takers dropped from 103 to 82.
For the Wilson report card with complete data sets, click here.
Intermediate Schools
On the intermediate school level, test scores showed eighth graders taking the language arts and literacy NJ ASK test showed the sharpest rise in advanced test score performance from 2008-2009. The intermediate school tests show that the categories roughly split down the middle on a rise in advanced test score statistics for the districts.
In the eighth grade language arts tests, the amount of advanced test scorers rose from 19.4-percent to 32.1-percent. This year included a slight rise in test takers from year to year from 489 in 2008-2009 to 514 in 2009-2010. The proficient score in the category dropped fro 76.1-percent to 61.7-percent. The partial score on the test rose from 4.5-percent to 6.2-percent year-to-year.
The intermediate schools showed a rise in advanced test scores from the sixth grader language arts test and the seventh grade language arts test, The advance scores for the seventh grade math test takes remained fairly stead from 40.5-percent scoring advanced in 2008-09 to 40.4-percent in 2009-2010.
The intermediate school test scores showed the sharpest drop in the sixth grade mathematics test, with the amount of high scoring students dropping from 48.6-percent to 43.3-percent. In the same time period the amount of students taking the test rose from 506 to 517. The proficient score rose from 42.7-percent in 2008-09 to 45.8-percent in 2009-10. The partial score rose from 8.7-percent to 10.8-percent.
Edison Intermediate School
Edison saw a rise in advanced test scores in most categories, with a slight rise in test takers in most grades.
EIS sixth graders had a rise in language arts advanced scores from 11.8-percent to 16.3-percent. Proficient scores dropped from 69.5-percent to 65.8-percent and the partial score dropped from 18.7-percent to 17.9-percent. The amount of test takers rose from 246 to 257. In math, the sixth grade advanced score rose from 47.6-percent to 51-percent, the proficient score went fro 40.2-percent to 37.7-percent and the partial score dropped from 12.2-percent to 11.3-percent.
The EIS seventh grade language arts advanced score was one of the few in the school to show a year-to-year decline. The advanced score went from 28.8-percent to 22.4-percent, the proficient went from 54.4-percent to 58.4-percent and the partial score went from 19.2-percent to 16.8-perent. The amount of test takers remained the same at 250 each year.
Seventh grade math scores at the school showed a rise in advanced from 38.7-percent to 40.4-percent, the proficient score went from 46-percent to 44.8-percent and the partial score fell from 15.3-percent to 14.8-percent.
For the Edison report card with complete data sets, click here.
Roosevelt Intermediate School
Roosevelt students showed a consistency in state test scores with a mix of rises and drops in the various categories judged in the school report card.
RIS eighth graders showed a rise in the language arts scores, with the advanced percentage rising from 22.3-percent to 34.7-percent. The proficient score dropped from 73.4-precent to 59.2-percent and the partial score rose from 4.3-percent to 6.1-percent. The amount of test takers rose slightly from 256 to 262.
The RIS eighth grade math scores stayed consistent with the advanced score going fro 53.9-percent to 53.8-percent, the proficient score going from 35.5-percent to 35.1-percnet and the partial score going from 10.5-percent to 11.1-percent. The number of test takers rose from 256 to 262.
In the sixth grade language arts test, the advanced score at RIS went from 14.2-percent in the advanced category to 16.2-percent, 76.5-percent in proficient to 71.4-percent and 9.2-percent in partial to 12.4-percent. The amount of test takers went from 260 to 259. The sixth grade math scores at RIS went from 49.6-percent to 35.9-percent in advanced, 45-percent to 54.1-percent in proficient and 5.4-percent to 10-percent in partial.
For the Roosevelt report card with complete data sets, click here.
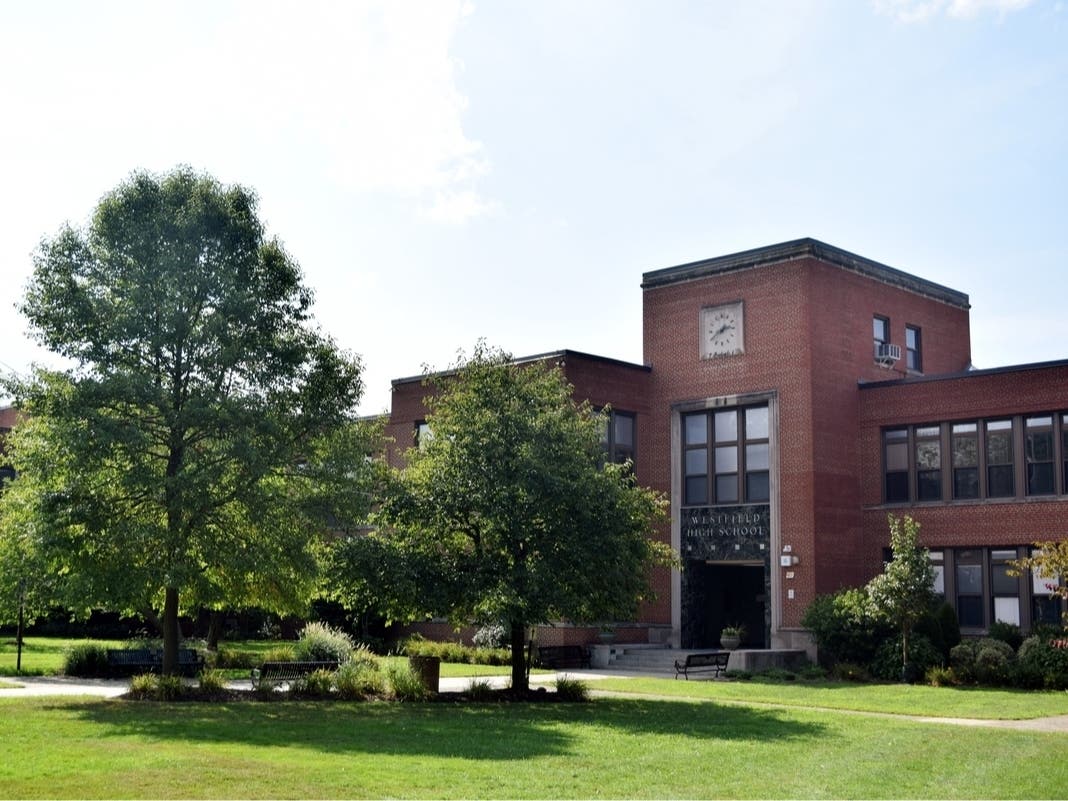
Westfield High School
At Westfield High School, the advanced score for the language arts and literacy high school proficiency assessment rose from 26.8-percent to 38.6-percent, with the number of students taking the test rising from 433 to 448. The advanced test score rose higher than the state average, which rose from 13.6-percent to 18.7-percent. The proficient score in Westfield dropped from 69.7-percent in 2008-09 to 57.8-percnet in 2009-210. The partial score rose slightly from 3.5-percent to 3.6-percent.
In the HSPA mathematics test, Westfield students showed a slight drop in the advanced score from 54.8-percent in 2008-09 to 52.1-percent in 2009-10. The proficient score saw a slight increase from 38.1-percent to 38.9-percent, while the partial score rose from 7.2-percent to 8.9-percent. Sixteen more Westfield High School students took the math test with the number going from 431 to 447.
The report card showed that 970 Westfield High School students took AP classes in 2009-10 with 840 choosing to take the AP exam in their classes. Psychology proved to the most popular AP class with 161 students enrolling and 125 taking the exam. Computer Science A, Environmental Science, French, German, Latin and Macroeconomics saw no AP students in 2009-2010, but all six classes showed students taking the AP exam last year. Physics C Mechanics was the only AP class to show a 100-percent exam rate with all 19 students taking the AP exam in the class.
The report card showed that Westfield High School’s AP participation for juniors and seniors was higher than the state average. The WHS participation rate was 42.9-percent with the state average being 19.9-percent.
For the WHS report card with complete data sets, click here.
County Financial Data for Schools
Town Name Median Years of Experience 2008-2009Median Salary 2008-2009 Median Years of Experience 2009-2010 Median Salary 2009-2010
State Average
(for district's with a high school)
21 $114,950 20 $117,895 Berkeley Heights 16 $121,195 16$126,028 Clark 15
$108,000 14 $119,000 Cranford 23
$115,130 24 $125,000 Elizabeth 18
$109,690 17 $107,594 Garwood 17
$88,482 16 $89,320 Hillside 26
$103,755 27 $107,245 Kenilworth 28
$118,664 21 $122,224 Linden 29
$119,805 23 $123,031 Mountainside 14
$117,000 15 $122,031 New Providence 11
$121,128 12 $126,215 Plainfield 15
$116,000 16 $124,150 Rahway 17
$108,622 17 $114,907 Roselle 13
$93,956 10 $93,956 Roselle Park 24 $104,138 25 $107,375 Scotch Plains 24
$129,668 16 $129,668 Springfield 16
$115,494 17 $115,379 Summit 28
$130,625 23 $134,768 Union County Vocational 16
$98,584 17 $101,413 Union 21
$114,950 22 $118,950 Westfield 21
$118,884 26 $127,656 Winfield 23
$95,760 24 $99,591
Faculty Years Experience and Median Salary
Median Salary 2008-2009 Median Years of Experience 2009-2010 Median Salary 2009-2010 State Average 9 $59,545 10 $61,840 Berkeley Heights 9
$61,623 10 $61,602 Clark 9
$52,473 9 $54,365 Cranford 9
$58,571 9 $57,903 Elizabeth 8
$59,979 9 $63,239 Garwood 12
$53,021 10 $51,773 Hillside 8
$60,067 8 $62,740 Kenilworth 8
$61,170 9 $64,377 Linden 8
$56,773 9 $59,204 Mountainside 9
$54,592 10 $57,032 New Providence 9
$62,276 10 $65,112 Plainfield 12
$70,470 13 $70,970 Rahway 8
$57,069 8 $59,959 Roselle 7
$50,401 5 $52,347 Roselle Park 8
$57,347 8 $55,988 Scotch Plains 8
$59,765 9 $60,368 Springfield 8
$63,306 9 $66,251 Summit 10
$60,752 10 $66,289 Union County Vocational 4
$53,537 5 $54,317 Union 8
$61,586 8 $64,045 Westfield 9
$62,639 10 $65,230 Winfield 11
$50,579 12 $52,603
Cost per pupil
Town Name Cost per pupil 2008-2009Comparative cost per pupil 2008-2009
Cost per pupil 2009-2010 Comparative cost per pupil 2009-2010 State average $15,221 $12,983 $15,538 $13,833 Berkeley Heights $14,664 $15,168 $14,907 $13,425 Clark $12,919 $11,430 $13,547 $12,158 Cranford $13,565 $12,646 $13,810 $12,831 Elizabeth $16,600 $15,217 $17,507 $16,242 Garwood $11,843 $11,217 $14,753 $10,868 Hillside $14,677 $12,510 $14,954 $12,950 Kenilworth $13,795 $12,163 $14,861 $13,145 Linden $16,129 $12,936 $16,469 $13,174 Mountainside $14,866 $12,860 $14,276 $12,409 New Providence $14,217 $12,960 $14,590 $13,245 Plainfield $15,308 $17,739 $14,710 $15,553 Rahway $13,672 $12,050 $14,428 $12,682 Roselle $16,775 $13,398 $17,730 $14,100 Roselle Park $13,876 $13,005 $14,436 $13,453 Scotch Plains $13,759 $11,973 $13,711 $11,975 Springfield $15,766 $13,698 $15,670 $13,685 Summit $15,003 $13,753 $15,729 $14,411 Union County Vocational $13,405 $12,243 $12,974 $12,194 Union $14,769 $11,859 $15,532 $12,364 Westfield $13,220 $11,781 $13,553 $12,009 Winfield $18,907 $18,151 $19,208 $18,371
Revenue
Town Name 2008-2009 Revenue from Local Source2009-2010 Revenue from Local Source State average 50% 51% Berkeley Heights 79% 80% Clark 79%
79% Cranford 84%
84% Elizabeth 11%
11% Garwood 80%
76% Hillside 51%
50% Kenilworth 74%
74% Linden 68%
68% Mountainside 77%
84% New Providence 88%
89% Plainfield 13%
14% Rahway 59%
59% Roselle 46%
44% Roselle Park 60%
60% Scotch Plains 90%
91% Springfield 91%
91% Summit 91%
93% Union County Vocational 21%
21% Union 54%
59% Westfield 89%
90% Winfield 45% 45%
Get more local news delivered straight to your inbox. Sign up for free Patch newsletters and alerts.