Neighbor News
Student Achievement related to Family Income
Data on grade 3-8 achievement during 2009-13 is shown for some local school districts

Researchers at Stanford Univ. have constructed a database called SEDA (Stanford Education Data Archive). This database is the result of information from millions of standardized reading and math tests given during 2009-2013 to grade 3-8 students in every state. MAP and NAEP data is included. The data was processed via statistical methods to provide consistency between the various formats in the source data. A recent NY Times article (interactive version available at (www.nytimes.com/interactive/2016/04/29/upshot/money-race-and-success-how-your-school-district-compares.html?_r=2) provides some study results of demographic gaps using SEDA.
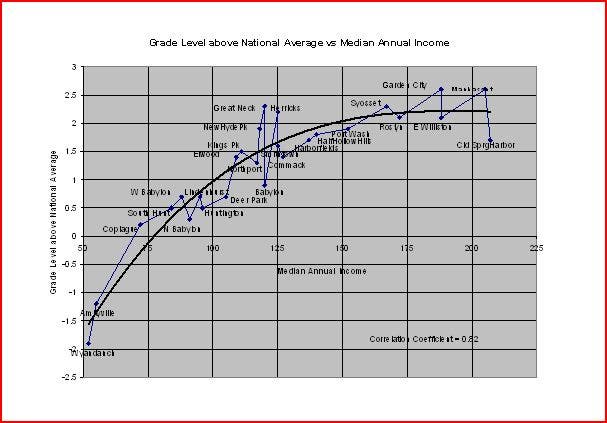
It is well known that student achievement is closely tied to family income. However, it was considered of interest to quantify this relationship for some local school districts using SEDA. The above graph shows Grade 3-8 student achievement during 2009-13 versus median annual income (both at the district level) for a particular set of local school districts. The districts used in the chart include the 18 participating districts in Western Boces (Suffolk) plus some high scoring Nassau County districts (Port Washington, Manhasset, Great Neck, Roslyn, Garden City, Herricks, New Hyde Park, Syosset and East Williston). Student achievement is defined as the “grade level of students in grades 3-8 during 2009-13 relative to the national average grade level”. The graph clearly confirms that family income is a very good predictor of ELA/Math student achievement. The graph shows, for example, that Commack grade 3-8 students are 1.4 grade levels above the national average while Manhasset and Garden City grade 3-8 students are 2.6 grade levels above the national average and (therefore) 1.2 grade levels above Commack grade 3-8 students insofar as math and ELA subjects are considered). Of course, students are more than a test score, and other factors enter into assessment of their overall achievement. .
The three highest Math/ELA-performing districts (grades 3-8) in WBOCES are indicated on the graph as Harborfields, Half Hollow Hills, and Cold Spring Harbor; they are also the districts with the highest median income in WBOCES. Looking back at an article I wrote regarding NYS ELA test performance in October, 2014 (“2013 & 2014 ELA Results”; Bulletin Board), it is noted that Harborfields and Cold Spring Harbor had the highest percentage of students (in that group of districts) scoring proficient in ELA in both years. One can conclude that, since the results are predictable - the correlation coefficient between income and achievement is 0.82 for the 27 districts - , then at least some of the ELA/Math tests used in the data base serve no obvious purpose. We know what the results will be before the test is taken. This is especially the case for the NYS ELA/Math annual tests where results are not used to assist individual students.
Find out what's happening in Commackfor free with the latest updates from Patch.
This leads to additional questions regarding requests of school districts for more and more money regardless of enrollment declines, additional state aid and low inflation.. In fact, there is little correlation between student achievement and expenditures/pupil. For the above districts, a correlation coefficient of 0.2 was calculated (it would probably be even closer to zero if more districts were included). Perhaps this has something to do with the use of these funds. In that regard, one might note the following Wikipedia – Commack statement: “Commack administrator and teacher salaries are among the highest in New York State”.