Community Corner
Virginia Among Best States For Drivers: Report
According to a website, Virginia ranks as one of the best states for drivers. Do you agree?

In spite of northern Virginia drivers battling clogged interstate highways and riding toll prices at almost any time on a daily basis, a new ranking of the best and worst states to drive in has good news. Virginia is one of the best states in the country for drivers, according to a new ranking by the personal finance website WalletHub.
Along with the aggravation of sitting in traffic, delays mean money, says the website, costing the average driver $1,400 per year in the United States. Traffic jams aren't the only hazard drivers can face, there can also be dicey road conditions and fluctuating gas prices to vex drivers.
Taking those conditions and other factors into consideration WalletHub ranked the states from best to worst for drivers, with No. 50 being the absolute worst. That honor goes to Hawaii, while the rest of the bottom five includes Washington, Maryland, California and Connecticut. Virginia places at No. 13 on the list. The remainder of the best states for driving is made up of Oregon, Georgia, Alabama, Arkansas and Illinois.
Find out what's happening in Fredericksburgfor free with the latest updates from Patch.
Despite earning low scores for commute time, miles driven per person and incidents of bad driving, Virginia had a much higher ranking than neighboring Maryland because the Commonwealth has cheaper gas prices, pays less for car maintenance and car insurance, and has a lower rate of car theft, WTOP reports.
The states ranked in the top five for drivers are:
1. Texas
2. Kansas
3. Nebraska
4. Iowa
5. North Carolina
Find out what's happening in Fredericksburgfor free with the latest updates from Patch.
See the full WalletHub report here.
WalletHub Methodology
To help drivers identify the states that provide the best commuting conditions, WalletHub compared the 50 states across four key dimensions: 1) Cost of Ownership & Maintenance, 2) Traffic & Infrastructure, 3) Safety and 4) Access to Vehicles & Maintenance.
We evaluated those dimensions using 23 relevant metrics, which are listed below with their corresponding weights. Each metric was graded on a 100-point scale, with a score of 100 representing the best for drivers.
Finally, we determined each state's weighted average across all metrics to calculate its overall score and used the following scores to rank-order our sample.
For metrics marked with an asterisk (*), the square root of the population was used to calculate the population size in order to avoid overcompensating for minor differences across states.
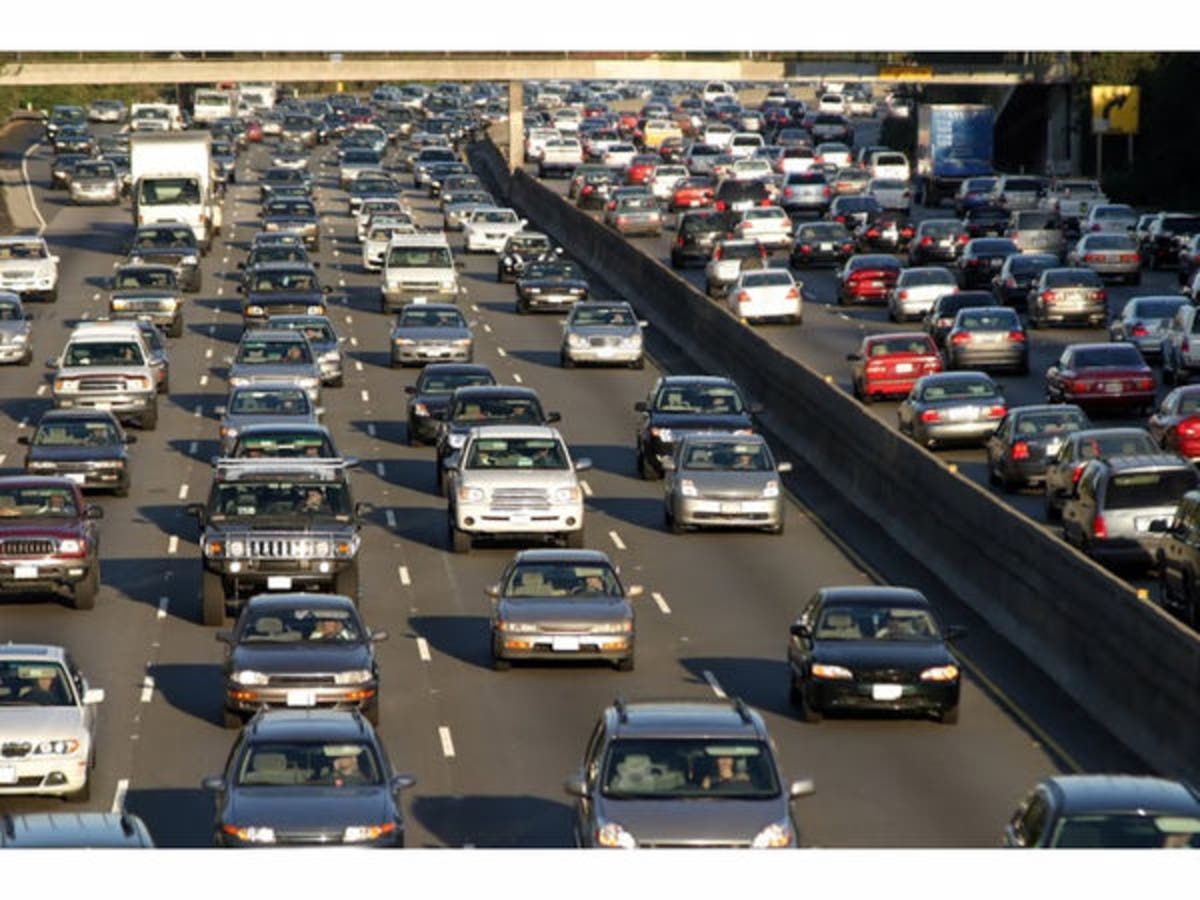
Image via Shutterstock
Get more local news delivered straight to your inbox. Sign up for free Patch newsletters and alerts.